

 CCMS Selfmonitoring Monitor for Instance-Specific Data
Use
The SAP CCMS Technical Expert Monitors monitor set contains the CCMS Selfmonitoring monitor, which displays the status of the monitoring architecture and of the Alert Monitor. The monitor displays, among other things, whether the Alert Monitor was able to perform the following actions:
Both the
 CCMS agents and individual Alert Monitor methods (data collection methods and auto-reaction methods) can display problems and their status in the Selfmonitoring tree.

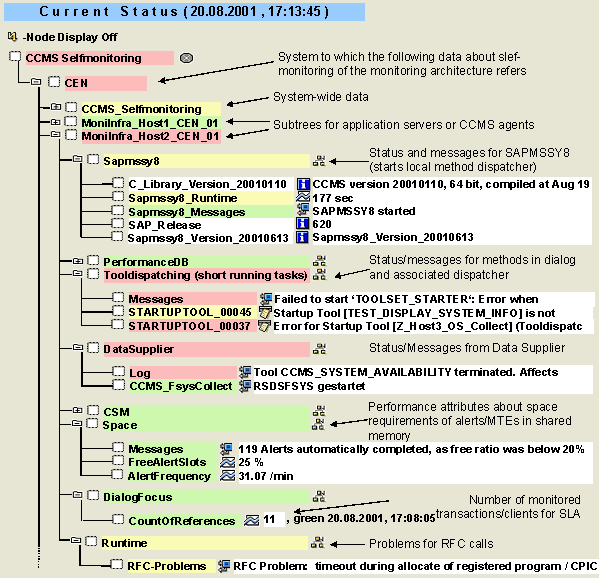
The CCMS Selfmonitoring monitor consists of multiple subtrees; on the one hand, the system-wide subtree with the title CCMS Selfmonitoring below the relevant system (see
Features
The subtrees MoniInfra_<Name> contain data either about a CCMS agent (SAPCCMSR and SAPCM3X) or about an application server. The structure of the subtree is different in each case, and you should therefore choose your naming convention so that the two types of subtree can be clearly distinguished from each other. We recommend that you use the naming convention <Host_name>_<System>_<Instance-System_number> for your application servers. The names of the subtrees that monitor CCMS agents, on the other hand, have the structure MoniInfra_<Host_name>.
In the case of an application server, the subtree consists of the following monitoring objects:
This program runs every five minutes on each monitored instance in the context of the AutoABAP SAPMSSY6, starts the local method dispatcher (which is responsible for methods in dialog) and ensures that the properties and methods in the shared memory and the database are reconciled.
This MTE specifies the release of the kernel (and therefore of the application servers) that created this node.
This MTE specifies the runtime of the program SAPMSSY8, which occupies a dialog work process during its run.
An alert in this MTE indicates that the data collection methods started by SAPMSSY8 are running for too long. This extends the runtime of SAPMSSY8 itself. SAPMSSY8 must not run for longer than five minutes. Otherwise, the next start of the program is before the end of its previous run.
This problem does not normally occur with data collection methods delivered by SAP; however, individual SAP methods could have long runtimes if they have to evaluate large quantities of data (for example: transactional RFC in the case of problems with failed tRFC calls).
Check whether you have included your own data collection methods in the monitoring architecture and whether these methods caused the performance problem. Check the Data Supplier subtree (see below) for error messages or runtime messages.
Runtime alerts from SAPMSSY8 can also be connected with general performance problems. For this, check the
This MTE contains messages output by SAPMSSY8. An alert can indicate that the data collection for the monitoring architecture is not functioning error-free. If SAPMSSY8 is terminated due to a data supplier that is not functioning correctly, the program automatically sets this data supplier to the status "fatal error", and does not start it again during the next run. SAPMSSY8 should therefore function normally again at the next automatic start.
This MTE contains the valid SAP Basis release of the application server.
CCMS uses this version number as an indicator for necessary changes. If a new
This subtree contains information about the performance database of the monitoring architecture. This database contains performance data that is collected and aggregated in accordance with the user’s specifications. The CollectionRuntime attribute displays the runtime of the job that runs daily to transfer the performance data to the database; CollectionMessage contains possible messages from this job.
This MTE contains, in the log attribute Messages, runtime messages from the local method dispatcher that starts the methods that are to run in dialog. Methods that are started by this dispatcher can add their own status MTEs, meaning that you can also find runtime and error messages here.
As the monitoring architecture is an infrastructure with a modular structure, problems in certain methods affect only certain MTEs. The majority of the monitoring functions of the monitoring architecture are not affected by method errors.
This MTE contains the runtime messages from data suppliers of the monitoring architecture. Depending on the programming of the data supplier, these messages could appear either in the shared log attribute Log or in a separate MTE for the corresponding program. For information about the programming of a data supplier, see "Creating a Data Supplier for the Alert Monitor" in the SAP Service Marketplace under http://service.sap.com/systemmanagement ® System Monitoring and Alert Management.
If an error occurs while filling or updating the
As errors of this type are usually only temporary, you should first repeat the operation that failed. If the error persists, contact SAP.
This MTE contains attributes about remaining space in the monitoring segment of the shared memory:
If the storage space in the monitoring segment is insufficient, you must
An analysis method is assigned to all three MTEs with which you can display a precise breakdown of the remaining storage area by alerts and by MTEs and attributes of the various categories.
The performance attribute CountOfReferences shows the number of defined references for
This MTE displays problems in the lower layers of the monitoring architecture. Errors during data transfer by RFC are displayed in the log attribute RFC-Problems.
Activities
To start the monitor, follow the procedure below: