Using the Memory Inspector Transaction
Documentation: The Memory Inspector Transaction in Detail
Documentation: The Memory Inspector in the New ABAP Debugger
Starting the Memory Inspector Transaction and Taking Memory Snapshots
The first time that you start the Memory Inspector, you may find an empty start screen like the one below. If so, then you need to take one or more memory snapshots before you can proceed with an analysis of memory consumption.
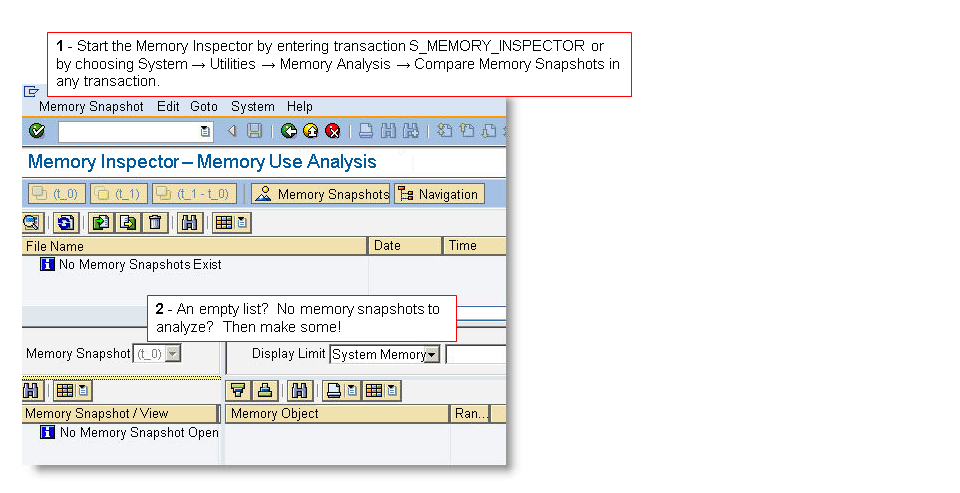
Take memory snapshots of the same program. It's of course not possible to compare snapshots of different programs. Usual purposes for taking memory snapshots are:
-
Checking how high the memory consumption of a program is. The question you would pose to yourself is: Does the application use more memory than it should or than I expect? If possible, take such a snapshot when the application is in stress testing or scalability testing, or in a production system.
-
Checking for memory leaks, unexpected increases in the memory consumed by an application over time. Usually, memory leaks result from programming errors: not freeing or destroying dynamic ABAP memory objects when they are no longer needed.
Of course, you will want to focus in memory analyses on ABAP applications that run for a long time continuously. A program that stays open to process one work item after another or a program that runs as a long-running batch job are both candidates for verification of correct memory usage.
Programs that run only discretely and briefly - as a short dialog transaction or to handle a single discrete request - are unlikely to cause memory consumption problems; when they end, they free their memory resources. You can also scan for memory abusers with transactions SM04 and STAD.
Here are some tips for taking snapshots that yield a useful comparison in the Memory Inspector:
-
Take snapshots at identical, well-defined points in an ABAP application. For example, take a snapshot before processing an item from a work list, process the work item, and then take a second memory snapshot before processing the next work item.
-
Do not take a memory snapshot when an application has first started or at the processing of the first work item. Wait until all of the programs and resources used by the application have been loaded.
-
Make sure that you run through exactly the same functionality before each snapshot. Otherwise, you are comparing apples and oranges, and you will have a hard time recognizing real memory leaks.
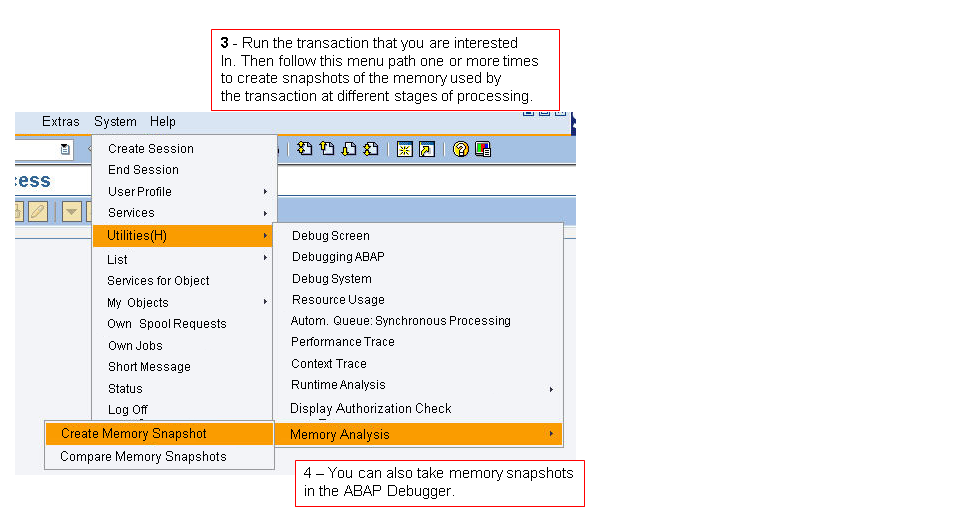
There are also other ways to take a memory snapshot:
-
In the New ABAP Debugger, from the initial debugging screen, choose the Replace Tool button from the panel on the right of the debugger screen. Then open the Memory Management folder and choose Memory Analysis. Choose Services of the Tool again and then choose Create Memory Snapshot.
-
In the classic ABAP Debugger, choose
 Development
  Memory Analysis Create Memory Snapshot
  .
. -
Enter /hmusa in the toolbar input field. You must be in a transaction to do this.
-
In your code, Call the static method WRITE_MEMORY_CONSUMPTION_FILE of the system class CL_ABAP_MEMORY_UTILITIES at the point at which you want to take a memory snapshot.
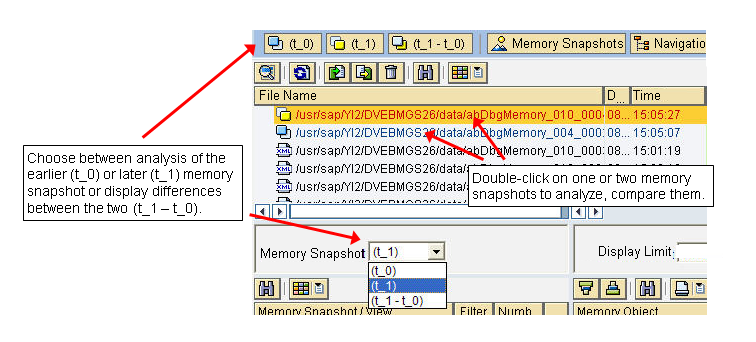
Opening Memory Snapshots for Analysis
Double-click on one or two memory snapshots in order to open them for analysis. The Memory Inspector automatically names the earlier snapshot T_0 and the snapshot that was taken later T_1.
Choose from the entries in Memory Snapshot or use the buttons at the top of the window to switch between analyzing the older snapshot (T_0), the newer snapshot (T_1), or the comparison between the two snapshots (T_1 - T_0). In a comparison, the Memory Inspector always shows differences with respect to the later snapshot - how T_0 changed to become T_1.
Message 'The memory snapshots are from different roll areas and therefore cannot be compared': The Memory Inspector may occasionally refuse to compare two memory snapshots. It then displays the message cited just above. This problem occurs when two snapshots are not comparable because, for example, internal IDs of memory objects have been changed after a switch to a new roll area and internal session. The solution is try again with new memory snapshots.
Understanding Memory Analysis Views
The sections linked below explain what you see in the various analytic views that the Memory Inspector offers. The analytic tools become active only when you open one or two memory snapshots for analysis.
-
The Overview shows the memory consumption of a program according to main categories of ABAP memory.
Use the Overview in snapshot-comparison mode to see quickly whether memory consumption has changed, and if so, by how much.
-
The Dominator Tree shows the dynamic memory objects in an ABAP program, together with the variables that refer to them.
This view is similar in content to the Ranking List. But there are two differences:
-
The Dominator Tree cannot compare snapshots. If you want first to see what has changed between two memory snapshots, start with the Ranking List.
-
The Dominator Tree shows the reference hierarchy in memory objects.
If, for example, an attribute of a class object references a memory object, then the memory object is shown as a local, subordinate object, existing in the scope of the class object. The Ranking List displays all memory objects as top-level objects.
Use the Dominator Tree when you need to analyze the keep-alive relationships in referenced dynamic memory objects.
For example, if you are analyzing ABAP Objects, then it will be much easier for you to see containment relationships between instances of classes and memory objects if you use the Dominator Tree.
-
-
The Ranking List and Ranking List by Type rank memory objects in the ABAP program by size. They also show references to objects.
Use the Ranking List as an alternative to the Dominator Tree when you need to compare memory snapshots and highlight changes in the set of memory objects and in individual objects. The Dominator Tree cannot compare snapshots.
The Ranking List by Type ranks memory objects in groups according to their defined types in the ABAP program. The Ranking List by Type can show you whether many instances of a small memory object use in sum a lot of memory.
-
The Tables, Classes, and Programs views offer dedicated views appropriate to each type of memory object. For example, in the Table view, you can study the internal tables in use in the ABAP program, with the total lines, bound storage, and allocated storage neatly and clearly broken out for each table.
-
The Expert views show you memory allocations in the Memory Management System ( System Memory) as well as a breakdown of memory allocations by area within the Memory Management System. You can ignore these views unless SAP Support asks you for information from one of them.
-
The Object Cycles (SCC) view shows you strongly connected components among the memory objects of an ABAP program. SCCs may be important if they lock up large amounts of memory unnecessarily.