Editor
Using the Editor, you display the current source code of a program or screen. The currently processed statement is then marked with a yellow arrow.
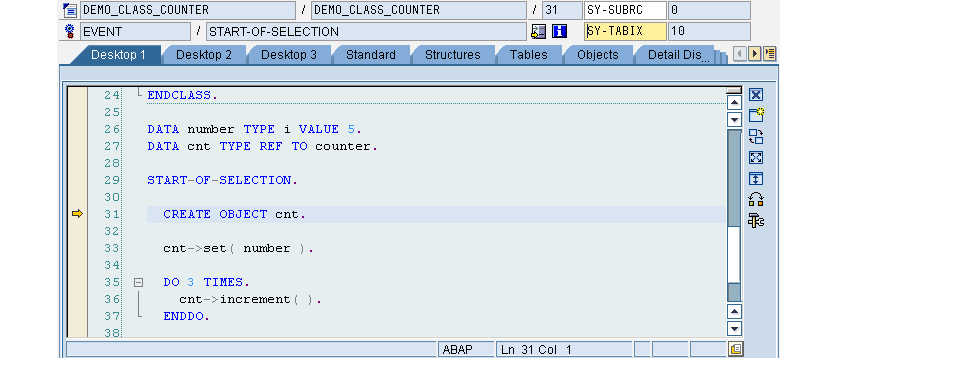
The source code is examined with the same functions as in the classic Debugger, whose icons are located directly beneath the title bar.
-
Single step (F5)
-
Execute (F6)
-
Return (F7)
-
Continue (F8)
Double-clicking the data object in the editor with the left mouse button will transfer this, together with its current content, to the Overview of Variables. If the overview of variables has not yet been part of the work area, it will be displayed after the double-click action. If the work area already has the highest number of tools allowed (allowed), a second window will ask you which tool you want to swap.
If you double-click a data object, the system will always branch first to the overview of variables. If you double-click the data object again, the details view for this data object will be displayed. For example, if you double-click a structure in the Editor, this will first be adopted in the overview of variables. If you double-click it again, it will be displayed in the structure display.
If you double-click outside of the data object, a breakpoint will be set in the Editor. If this line in the Editor already had a breakpoint, the existing breakpoint will first be deactivated. Another double-click within this line will delete the breakpoint for good.
The Editor tool provides a range of services that you can call through the Tool Services function. Here, too, the editor line is limited to 72 characters. This improves the readability of very wide source code lines. Alternatively, you can use the Maximize Horizontally function.