Layout of the User Interface
Start Screen
Title Information
Flow Control
Program Information and System Variables
Work Areas
1. Start Screen
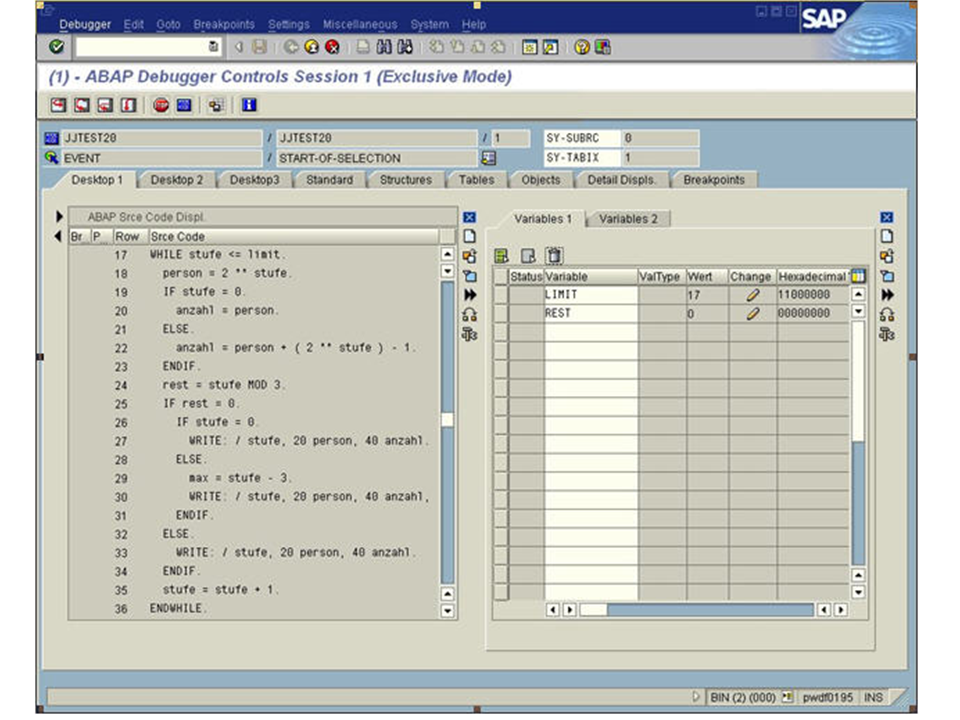
After you have started the ABAP Debugger, the system displays the view shown below, with the ToolsEditor and Display of Variables. This clearly shows that the basic setting of the user interface covers four main areas:
Title Information
Flow Control
Program Information and System Variables
Work Areas
2. Title Information
As soon as you have started the ABAP Debugger, you will see the message Session "x" connected to Debugger in the status line of the application. X is the number of the current external mode. At the same time, the following text is displayed in the Debugger window: (x) - ABAP Debugger controls session x (exclusive mode). In this way, the link between application and Debugger mode is visible at all times.
The display for exclusive mode means that the application to be analyzed exclusively occupies a work process of the application server during debugging. If all exclusive debug work processes are occupied, the Debugger is switched to non-exclusive mode. In this case, the following text appears in the title line: (x) - ABAP Debugger controls session x (non-exclusive mode). In this state, you can attempt to again occupy a work process exclusively by choosing  Debugger
  Exclusive Debug Mode
  . However, this is only possible if another exclusive debug work process has become available in the meantime.
The difference between exclusive and non-exclusive mode is that the Debugger function is limited in non-exclusive mode. The limitations are mostly due to that fact that a roll-out is forced in the application in non-exclusive mode after each Debugger view. Therefore, a database commit must be executed. This has the following consequences:
Debugging mode is not possible between the statements SELECT and ENDSELECT because the database cursor needs to be closed using a Commit. In this case, program execution is terminated.
Debugging mode is not possible for conversion or field exits.
Due to the Commit, inconsistent datasets can occur in the database.
For this reason, non-exclusive mode is impossible in productive systems. If the number of exclusive Debugging work processes is occupied, the runtime error DEBUGGING_NOT_POSSIBLE is triggered whenever you attempt to start another Debugger. The number of work processes that are available exclusively for Debugging is defined by the profile parameter rdisp/wpdbug_max_no. In development systems it should be approximately half the number for dialog work processes.
3. Flow Control
Underneath the title line, you see the icons for Flow Control and special functions such as Set Breakpoint and Save Layout.

In addition, the following functions are available in this area:
Loading the current source code
Saving the configured work areas
Displaying the short documentation
4. Program Information and System Variables
Underneath the control area, the current screen and program names are displayed together with the line number, event type, and event name. The adjacent column lists the current return values of the system variables sy-subrc and sy-tabix. However, the names of other data objects can also be entered here instead of the system variables. Their contents are only displayed if these data objects actually exist in the program section just processed.
5. Work Areas
The greater part of the Debugger window is taken up by the work areas, which can be designed by each user as required. Altogether, nine work areas are available. These can be displayed by clicking the respective tab titles:
Desktop1
Desktop2
Desktop3
Standard
Structures
Tables
Objects
Detail Displays
Breakpoints
The three user-specific work areas Desktop1-3 initially contain the same tools Editor and Variable Display. In addition, the new Debugger has five other work areas that cover many typical debugging situations through their predefined settings. They also make it superfluous to have your own user interface design if user requirements are fully taken care of.
Work Area |
Type of Analysis |
Tools |
|---|---|---|
Standard |
Source Code Analysis |
Editor, Stack, Variable Display |
Structures |
Comparison of Structures |
2 Structure Views |
Tables |
Comparison of Internal Tables |
2 Table Views |
Objects |
Comparison of Objects |
2 Object Views |
Detail Displays |
Comparison of Individual Fields |
2 Detailed Views |
Breakpoints |
Editing of Breakpoints |
Breakpoint View |
All the new work areas can be changed by the user with respect to size and composition. The individual options available are described in the section Designing Work Areas