

 Availability and Performance Overview Monitor
Use
With this monitor, you can perform
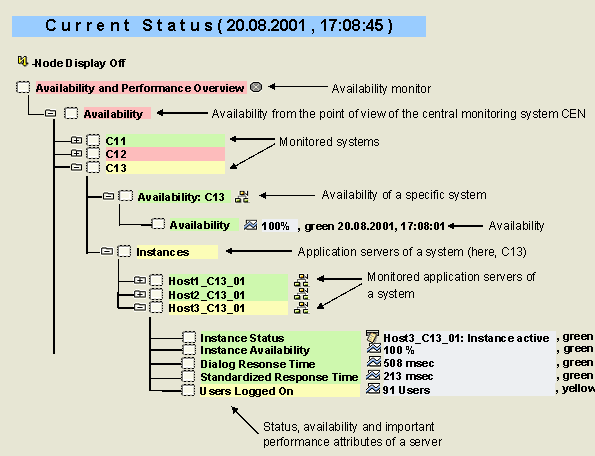
availability monitoring for selected systems and their application servers. The results of this monitoring are displayed in a tree structure, first for each system itself and below that for all of the system’s application servers. The monitor also displays the most important performance attributes for the status of the dialog system for the monitored application servers. For more information about selecting systems and application servers for monitoring, see Customizing Availability Monitoring.Description of the Tree Structure of the Monitor
Prerequisites
You have performed the
Installation of the Availability Agent CCMSPING.Features
Availability of Systems
Availability monitoring uses the stand-alone agent CCMSPING. This agent checks the availability of the message server of the corresponding system. A system is reported as active in availability monitoring if the message server responds to the availability agent’s query and at least one application server is registered as active with the message server.

The availability agent does not need to log on to a remote system to determine its availability. The data collection procedure with which you can check the availability of possibly hundreds of systems from a central Alert Monitor is therefore extremely fast. The availability monitor also waits for a short time (the default setting is 1.5 seconds) in case a system is unavailable.
The percentage value for availability is calculated from the availability for the last 15 minutes. As the default setting is for the method to be run every five minutes, the last three measurements should be included in the calculation. The threshold value was set by SAP so that an alert is generated at an availability of less than 75%. With one failed availability check and three values in the calculation, the availability is 66%. An alert is therefore triggered by one failed availability check.
Availability of Application Servers
In addition to the availability data for the monitored application servers, this monitor displays the most important values about the status of the dialog system:
|
Monitoring Tree Element |
Description |
|
Dialog Response Time |
Average response time for processing a dialog step |
|
Standardized Response Time |
As Dialog Response Time, but for a predefined standard transaction |
|
Users Logged On |
Number of users that are logged on to an application server |
For more information about these nodes, see
Dialog Overview Monitor.If an application server is not available, only a yellow alert is generated. You can check or restart application servers of a system by calling the  CCMS Control Panel (Transaction RZ03) in the relevant system.
Analysis Method
If you double click an MTE in this monitor, you start the analysis method Configure Availability and Performance Overview. You can use this method to activate or deactivate availability monitoring for individual systems or application servers. When doing so, note the following:
Activities
To start the monitor, follow the procedure below: