

 Displaying a Subtree as ALV Grid Control
Use
You can display monitors and subtrees with a symmetrical structure (see graphic) as a table in an
 ALV Grid Control using the analysis method CCMS_TREE_TO_ALVGRID:
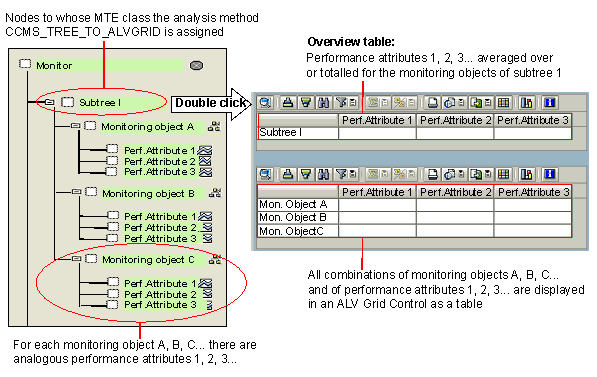
Displaying extensive subtrees as a table makes them significantly clearer, as they require less space and you can therefore see all relevant attributes at a glance.
As additional information, the performance attributes are averaged (for percentage values) or totaled (for absolute values) for all monitoring objects in the subtree and displayed in an overview table. To use this display, assign the analysis method CCMS_TREE_TO_ALVGRID to the superordinate node of the subtree.
This analysis method also provides you with the following functions:
Prerequisites
Assign the analysis method CCMS_TREE_TO_ALVGRID only to monitoring tree elements (MTEs) that have a symmetrical, multi-level subtree. In the above graphic, for example, this applies for the node Subtree I, which has a multi-level subtree (First level: Monitoring objects A, B, C; Second Level: Performance Attributes 1, 2, 3) with identically structured branches.
Procedure
You can assign the analysis method CCMS_TREE_TO_ALVGRID unchanged to multiple nodes. However, if you want to set method parameters (see below), we recommend that you first copy the method and only assign and set the parameters with the method copy.
Copy and Release the Method (Optional)
 ).
).  ) pushbutton.
Assign Method to an MTE or an MTE Class
) pushbutton, and choose the Analysis tab page.
) pushbutton.
Set the Method Parameter (Optional)
) pushbutton.|
Parameter Value |
Description |
|
NOD (No Display) |
Assign the value NOD to a parameter name to suppress the display of a particular row or column. In the Parameter Name column, enter the performance attribute or monitoring object that you do not want to display. |
|
AVG (Average) |
Assign the value AVG to a parameter name to explicitly display the average value for a column in the overview table. By default, normal numerical values in the overview table are totaled, while percentages are averaged. |
|
SUM (Summation) |
Assign the value SUM to a parameter name to explicitly display the total value for a column in the overview table. |

Note that you must specify the desired parameter names exactly and without the units in square brackets (such as
[%] or [MB]).Result
You have assigned the analysis method to the desired node. To start the method, choose the node by double clicking it. The system displays an ALV Grid Control with a table of the corresponding values.
Example
The following monitors contain suitable nodes for this analysis method; the nodes belong to the following MTE classes:
|
Monitor |
MTE Class |
|
Buffers (SAP CCMS Monitor Templates monitor set) |
R3Buffers (MTE class of the instance-specific subtrees) |
|
Availability and Performance Overview (SAP CCMS Monitor Templates monitor set) |
R3_Avail_InstancesSummary (MTE class of the instances of a monitored system) |
|
Monitors of the EMC Symmetrix monitor set |
MTE classes each under the virtual top node |