
 Performance Analysis with Raw Statistical Data
in the Functional Trace
Performance Analysis with Raw Statistical Data
in the Functional Trace

Scenario
A Web Dynpro application is showing a long runtime between two screen changes in the browser for a dialog step. You are to investigate this step in more detail and trace the problem to the component that is responsible for the long response time. Use the functional trace (transaction STATTRACE) to do this. The functional trace reads the raw statistical records (“DSR“ – Distributed Statistics Records) written by the individual components and displays them centrally.
Two components are involved in this scenario: a J2EE Engine and a connected ABAP backend system. The (Java) DSRs are written by the DSR service and are transported to the central system using the previously registered SAPCCMSR agent. For more information about the data’s route, see Displaying DSRs/Performance Traces of the J2EE Engine in the CCMS.
An advantage of the functional trace analysis is that the system does not need to be “exclusively” available, and that the utilized user can also execute other activities in parallel. The generated actions can be uniquely assigned later.
Procedure
To perform a performance analysis with raw statistical data in the functional trace, proceed as follows:
...
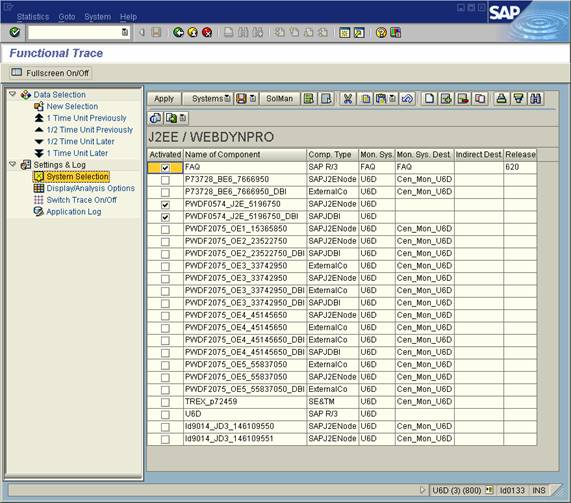
1. Start the STATTRACE transaction and choose the System Selection option in the Settings & Log tree. Since you are logged on to the central monitoring system, choose Systems → Local Systems. The system displays all components for which statistical data is collected in this central monitoring system.
2. Choose the desired components. In this example, this is the J2EE Engine pwdf0574and the connected back end system FAQ.
3. Under New Selection, specify the start date, start time, the read period, and (if known) the initial system. In this example, this is the J2EE Engine on which the ESS/Web Dynpro application is running.
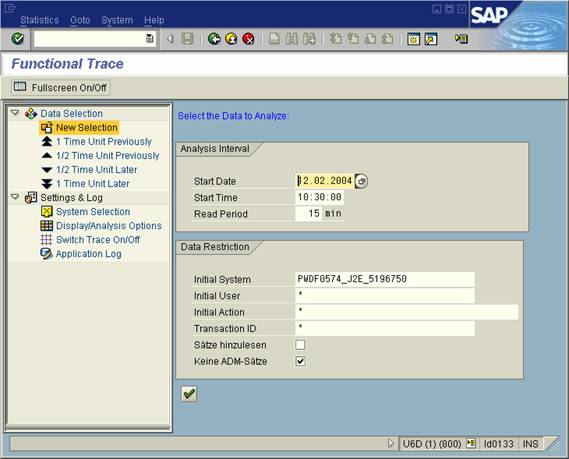
4. Confirm your entries.
The system displays a list with raw statistical data from all selected systems that meet the selection criteria. The first tree displays the steps until the logon, and the second expanded tree shows the usage of the actual (ESS) application.
In the overview, you can see a long step of around 16 seconds, which corresponds approximately to the response time at the front end.

5. Select the row. This opens the details for this statistical record:
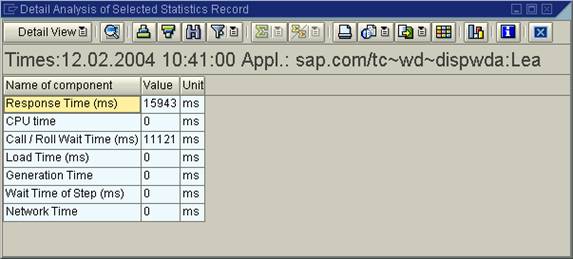
You can see that the response time of 15.9 seconds is mainly caused by the Call / Roll Wait Time (11.1 seconds).
6. Choose Detail View → Call Records.
The system displays an overview of the calls executed in this step by the J2EE Engine:
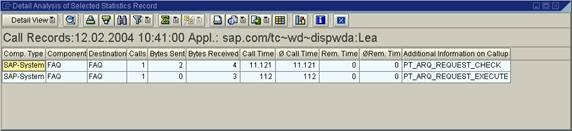
You can identify that two calls were executed in the target system FAQ, and that one of the calls (PT_ARG_REQUEST_CHECK) lasted more than 11 seconds. Since you also included statistics records from the FAQ system in the selection that you made, you can investigate the corresponding statistics record, which was generated by this call in the FAQ system, in more detail. It must be a statistics record of the subtype Server Record, since it was called by another system (in this case, the J2EE Engine), and the target server acted as the server:
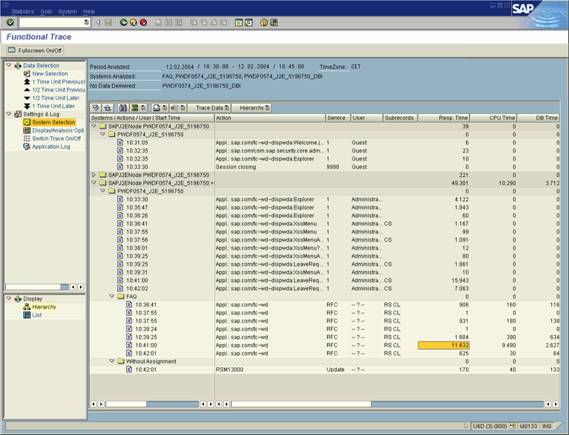
There is a record for which the time matches among the statistics records of the FAQ system (displayed in the hierarchical display under the FAQ node).
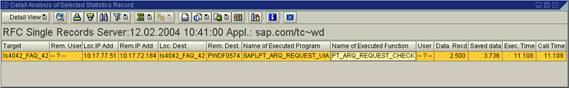
7. Select the statistical record by double-clicking it.
The system displays the details for this statistical record: Choosing Detail View → RFC Statistical Records Server allows you to identify that it relates to the function call for which you are searching (PT_ARG_REQUEST_CHECK):
8. Choose Detail View → Times to display the resource usage. You can see here that the majority of the time is used by the CPU Time (approximately 9.5 seconds):
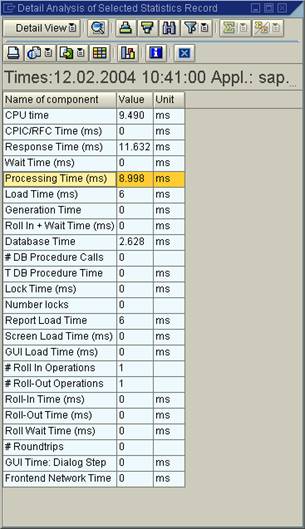
The CPU time consists of the CPU time used in the work process and the database interface. Since the database time is small by comparison to the CPU time (2.6 seconds) and the time contains the processing of the SQL statement on the database itself, it seems that this function call is very “CPU-intensive”.
Result
Since the CPU time is the largest component of the total response time by some distance, you should use other tools to try to find optimization potential in this area (for example, with an ABAP runtime analysis).