
 Performance Trace

Use
You can activate a performance trace to be able to analyze the performance of the J2EE Engine from the CCMS if irregularities occur. The performance trace provides duration information for the individual modules of the engine and therefore provides a finer granularity than the statistics records. Like the Distributed Statistics Records - DSRs, the performance trace can write data for actions that are processed over multiple components. There is a passport that is sent together with every communication to allow this.
Integration
The performance trace data reach the functional trace (CCMS display transaction STATTRACE), which can display performance traces as of SAP Web AS 6.40, in the same way as the raw data of the Distributed Statistics Records:
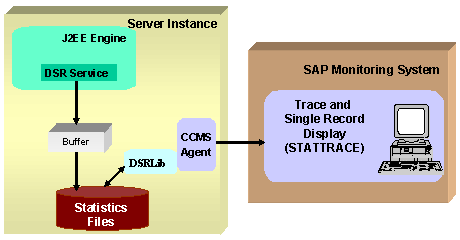
For more detailed information about the process shown in the figure, see Displaying DSRs/Performance Traces of the J2EE Engine in the CCMS.
Prerequisites
The following prerequisites apply so that performance trace data is written and displayed in the CCMS:
...
·
You must have
installed, registered, and activated the SAPCCMSR agent with the –J2EE
option. For more information about this, see
 Installing an Agent on
a Java Instance (Java Standalone System) or
Installing an Agent on
a Java Instance (Double-Stack System).
Installing an Agent on
a Java Instance (Java Standalone System) or
Installing an Agent on
a Java Instance (Double-Stack System).
· The central CCMS monitoring system must be an SAP Web Application Server ABAP 6.40.
· The Performance Tracing Service and the DSR Service of the J2EE Engine must be active.
By default, the services are already active. For information about starting the services if they have been deactivated, see the documentation for the Visual Administrator.
Features
The performance trace writes duration information for individual actions.
While the J2EE Engine is not transparent for the distributed statistics records (DSRs), and only the duration of the processing from an entry point to an exit point from the Engine is measured, the performance trace records duration information for the individual modules of the engine. For more information about this, see Performance Trace Recordings.
Activities
1. Activate the performance trace. For information about how to do this, see Activating the Performance Trace.
2. The trace is recorded, see Performance Trace Recordings.
3.
You can evaluate
the trace using the functional trace (transaction STATTRACE) in your central
monitoring system (CEN). For more detailed information about this, see the
Documentation for
STATTRACE.