
 DSR
Example: Simple Transaction Step
DSR
Example: Simple Transaction Step

In the J2EE Engine, statistics records are written for each action. An action is started when a request, such as an HTTP request, is sent to the component. This action has a certain duration and is divided into different time types, as shown in the diagram below:
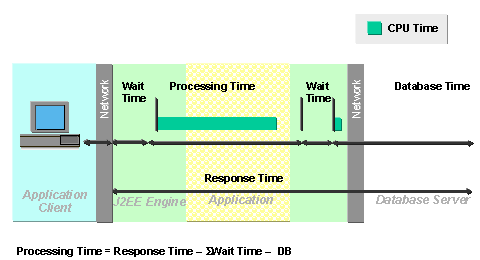
1. An HTTP request is sent to the J2EE Engine and initially waits in a queue (wait time).
2. The J2EE Engine then processes the request. To do this, it can, for example, call an application - a Servlet or an EJB. The action is processed, for which a certain period of time is required. This is called the processing time.
3. A database connection must then be created, if data is written to the database or read from it. If there is no free connection, the request is placed in a wait queue again.
4. The database call is then performed. The database is on a database server that, like the J2EE Engine, is defined as an independent DSR component. The gray bars before the database and the J2EE Engine are the component boundaries. The J2EE Engine component is left and the database server is called in the same context, that is, in the same action.
From the point of view of the calling client, which can write statistics, this action lasts the length of time indicated by the response time arrow. The J2EE Engine, which writes statistics, creates a main record at this point that shows a response time as the total of all of these times. As soon as it calls other components, such as the database, it writes a subrecord for this call (Call1 subrecord). If it calls the same component more than once within an action/a request, because it must read different configurations from the database simultaneously, it can combine these subcalls.
The database itself could also write statistics. It would start a main record at database time. However, as it is performing dependent processing, the calling J2EE Engine component transfers a small file with the name passport together with its communication, which contains details about the context or action in which it is called, and the database continues to write in this context. In this way, you can connect the data records that are distributed on different hosts.
5. The data records are stored in statistics files. The CCMS agent SAPCCMSR with the –J2EE option can read these and transfer them to the monitoring SAP system with which it is registered. A collector (Workload Collector for Statistics) is running on this monitoring system, which can aggregate this raw data and display it from various points of view in the Global Workload Monitor (transaction ST03G). You can display the raw, unaggregated statistical data and performance traces in the functional trace (transaction STATTRACE).
For an exact process description from the creation of the DSR in the J2EE Engine to its display in the CCMS, see Displaying DSRs/Performance Traces of the J2EE Engine in CCMS.

The J2EE Engine is a non-transparent entity for the distributed statistics records. They do not contain any information about processes within the engine. Only the Performance Trace provides duration information for the individual modules of the engine (HTTP, service, JMS, and so on).