 Job Monitoring
SAP Solution Manager provides a complete, centralized job monitoring concept based on the End-to-End Monitoring and Alerting Infrastructure (MAI). You can monitor the following types of jobs in a distributed system landscape:
ABAP jobs
BW process chains
SAP BusinessObjects (SBOP) jobs
SAP Data Services (DS) jobs
SMSE jobs
 Note
NoteThe SMSE jobs configuration allows you to monitor any type of externally scheduled job, using data pulled directly from the external scheduler.
End of the note.
To set up monitoring, you create monitoring objects to collect data from either managed systems or external schedules and report it to SAP Solution Manager. Job monitoring objects can be assigned to technical scenarios and business process steps or interfaces.
This unified concept allows you to monitor your jobs in multiple contexts:
Business process step or interface
Technical scenario
Technical system
Each monitoring object is assigned to a job documentation.
You set up monitoring objects by using a guided procedure that can be accessed from the Job Monitoring configuration in SAP Solution Manager Configuration, the Business Process Monitoring work center (related link solution administration, FIORI launch pad or the transaction SLAN
) and Job Documentation work center. The monitoring objects that you create can be reused across contexts.
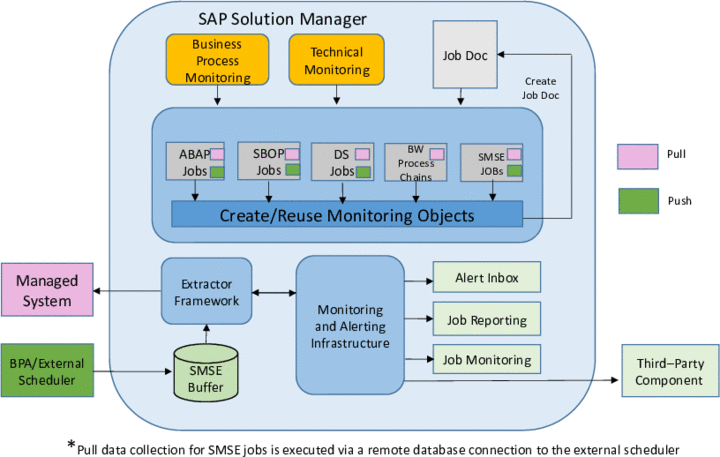
The following figure illustrates the unified job monitoring concept:
Data Collection Modes
Data providers collect metric values from the monitored objects and send them to the SAP Solution Manager Monitoring and Alerting Infrastructure (MAI), using either push or pull data collection modes:
Pull
For the pull mode of ABAP jobs and BW process chains, data collection is executed in the managed system itself (because the managed system has an ABAP stack).
For the pull mode of SAP Business Objects jobs and SAP Data Services jobs, data collection is executed in SAP Solution Manager by reading job data via Web Services.
Pull data collection for SMSE jobs is executed in SAP Solution Manager.The available implementation for SAP BPA by Redwood reads job data via a remote database connection. Other external schedulers need to be implemented on a project basis.
Push
External schedulers can push data to the SAP Solution Manager MAI via the Solution Manager Scheduling Enabler (SMSE) interface. If you choose to add jobs from your external scheduler when configuring monitoring objects for ABAP jobs, SAP Business Objects jobs, and SAP Data Services jobs, the data will be collected by means of SMSE push.
Job Type | Add from Managed System | Add from External Scheduler | Add Directly |
|---|---|---|---|
ABAP jobs | Pull | Push | Pull |
BW process chains | Pull | Push | -- |
SAP BusinessObjects (SBOP) jobs | Pull | Push | -- |
SAP Data Services (DS) jobs | Pull | Push | -- |
SMSE jobs | -- | Pull | Pull |
Integration
External Schedulers
Solution Manager Scheduling Enabler (SMSE) is an interface between SAP applications and external schedulers for scheduling jobs and job chains, and integrating business and infrastructure events. If you manage jobs with a SMSE-certified external scheduler, you can monitor core metrics of your jobs and view scheduling information in SAP Solution Manager. SMSE push monitoring using the MAI Infrastructure was introduced in SAP Solution Manager 7.1 SP12.
In SAP Solution Manager 7.1 SP14, we introduced a new method for monitoring externally scheduled jobs and job chains. The job type SMSE jobs allows you to flexibly configure monitoring for all jobs and job chains. Data is retrieved by directly querying the external scheduler. Once the monitoring objects are generated and activated, you can view detailed information about the job in the job monitor, including the job chain hierarchy, if applicable.
Note
SAP Central Process Scheduling by Redwood (SAP CPS)/SAP Business Process Automation by Redwood (SAP BPA) is supported for SMSE job monitoring by default. Other external schedulers may be connected on a project basis.
Third-Party Components
You can use third-party tools to handle alerts generated by the SAP Solution Manager alerting infrastructure. The OS Command Adapter provides a way to forward alert information provided by MAI BAdI implementations to third-party tools. You can also use MAI BAdI implementations to send e-mails or SNMP traps.
For more information, see Operating System Command Adapter.
Features
The Job monitor consists of different tab pages. The tab pages are as follows:
Overview
: There are three sections on the Overview tab page. The three sections are as follows:Status Overview
: In this section, you can monitor the aggregated status of the various monitored objects in different technical systems in the selected scenario. You can also view the total number of systems configured and the total number of alerts from the Alert Inbox raised for the technical systems. The color code indicates the various status.Red: errors
Yellow: warnings
Green: no error or warning
Grey: no data could be retrieved
Overview Monitor
: You can view the system types, monitored objects type, and status of the various monitored objects. On click of any system type link, it opens the system monitoring application in a new window and you can view the details of the configured technical systems, the status of the technical system and the alerts raised for the technical systemAlert Ticker
: You can view the number of alerts raised for the selected scope as well as the details of the alert. The top five recently occurred alerts are shown in theAlert Ticke
r that has red or yellow rating. On click of any alert, it takes you to the alert inbox where you can find further details on the alert.
Jobs
: On theJobs
tab page, the following features are available:You can view the configured jobs based on the filter criteria.
You can view the details of the instances of a job and the configured details metric.
Analytics
: On theAnalytics
tab, the following features are available:System Overview
enables you to get a graphical representation of the status metric for a selected timeframe.Performance Overview
enables you to get a graphical representation of the average run time of the configured jobs for a selected time frame
The other features available are as follows:
Incident and Notifications
: You can create incidents for support or send an e-mail or text message to system users, business partners, and external recipients. NoteWhen you create an incident for an instance on the Jobs tab page, by default the details of the instance are copied under Description.
End of the note.Auto-refresh
: You can set auto-refresh, and the details will be refreshed at the specified interval. You can also pause and restart the refresh.