Using the Application-Specific Memory Views in the New ABAP Debugger
The Application-Specific Memory Views in the New ABAP Debugger let you analyze memory use in two special program contexts:
-
Programs that use the services of the Internet Communication Framework (ICF, ICMAN) for HTTP and Web Services communication.
-
Web Dynpro for ABAP applications.
These views let you see the memory use in these important ABAP infrastructures. The views don't filter to show you your own HTTP client or server objects or Web Dynpro contexts. Instead they show you the memory use of the ICF or WD services that you are using through your own program objects. This data is only directly visible to you in these special views.
You will only need these views if you suspect that these infrastructures are contributing to memory problems, or if you just want to check that they are using memory efficiently.
Starting the Application-Specific Memory Views
To start the ABAP Web Dynpro and ICF views from the initial screen of the New ABAP Debugger, do the following:
-
From the tool bar at the right side of one of the debugger windows, choose Replace Tool.
-
In the popup which follows, open Memory Management.
-
Choose Application-Specific Memory Views.
-
In the View field, choose Application Web Dynpro or Internet Communication Framework to start one of the views.
If the context you choose is not active in the current program, then you will see a message reporting this fact. No memory objects are shown.
Using the Internet Communication Framework View
The ICF view shows you the memory use by the ICF for open HTTP client and server sessions. This information appears in the first item in the memory objects list under the heading Internet Communication Framework.
The ICF item appears only if an HTTP or Web Service object in your program is currently using the services of the ICF, that is, a communication session is active. Before a session is opened or after it is closed, the ICF view reports that there is no data to display.
As the graphic shows, you see both ICF objects for managing open HTTP sessions and application-side HTTP client and server objects.
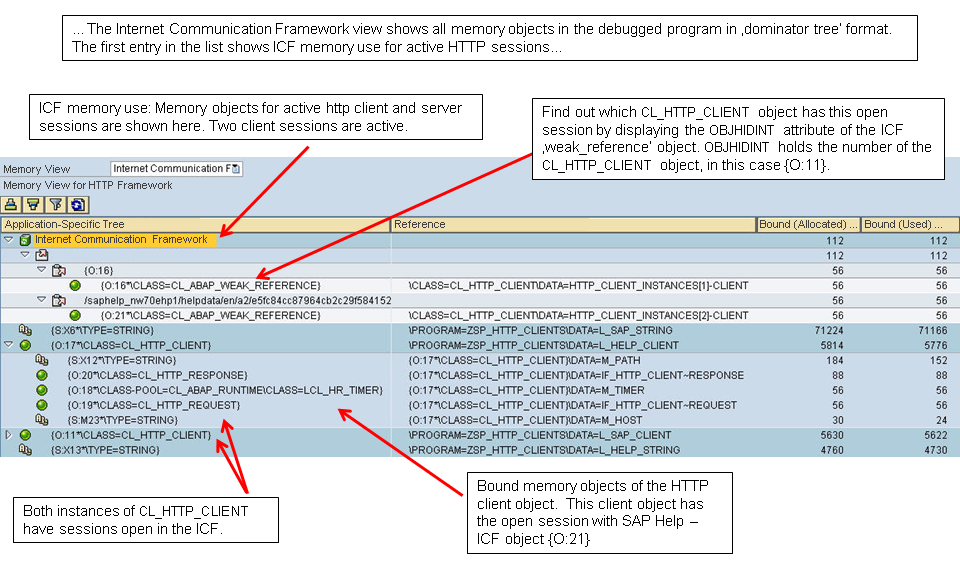
The ICF view also shows all of the other memory objects in the program that you are debugging. These are presented in Dominator Tree format, so that you can analyze the containment hierarchy in memory objects. You can see which subordinate memory objects make up the bound memory of higher-level memory objects.
Using the Web Dynpro View
The Web Dynpro view shows you the memory use of the Web Dynpro infrastructure when a WD application is running.
In addition to WD memory objects, the list includes all of the other memory objects in the program that you are debugging. These objects are presented in Dominator Tree format, so that you can analyze the containment hierarchy in memory objects. You can see which subordinate memory objects make up the bound memory of top-level memory objects.