Stack
Summary
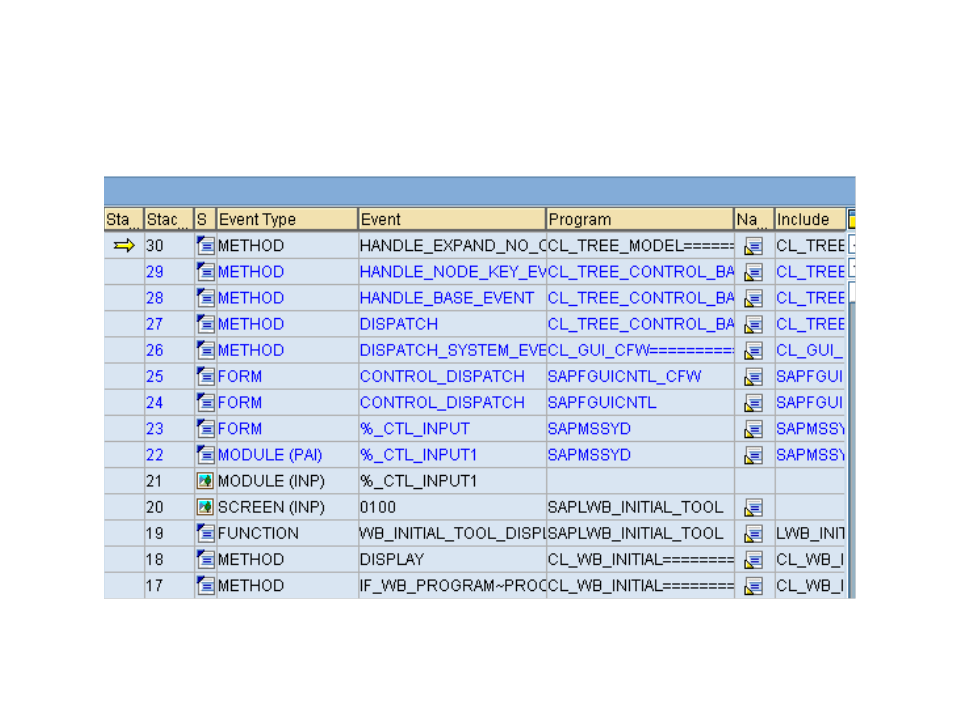
The current call stack is displayed in the Stack tool. You can display either the pure ABAP stack, the screen stack, or - as shown below - the combined screen and ABAP stack.
From each ABAP stack row, you can navigate to the Editor or the context of the stack entry.
Detailed Description
As you can see from the above figure, the following information is provided for each stack level:
-
Stack Depth
-
Stack Type (ABAP or Dynpro)
-
Event Type
-
Event Name
-
Program Name
-
Include Name
-
Zeile
To set the Debugger in the context of this stack level, double-click within the line -but outside the Navigation column -using the left mouse button Afterwards, the local variables that were defined there are visible. If the Editor is active in this work area, the source code belonging to this level will be displayed.
If you double-click the Navigate to Editor icon in the Navigation column, the system branches to the ABAP Editor - or Screen painter in the case of a screen - and displays the source code of the last position that was run through in this program section.
Stack Services
You can access the stack services using the button Services
 or the context menu.
-
Standard services: Search, download, navigate to options
-
Switch stack type: ABAP, screen, ABAP and screen. This setting only applies to the current stack instance. In the options of the stack tool, you can set the stack type for all stack instances (persistently as well).
System programs are highlighted in blue in the stack display. To be able to branch to a system program, System Debugging must be switched on.