

 Performance Overview Monitor
Use
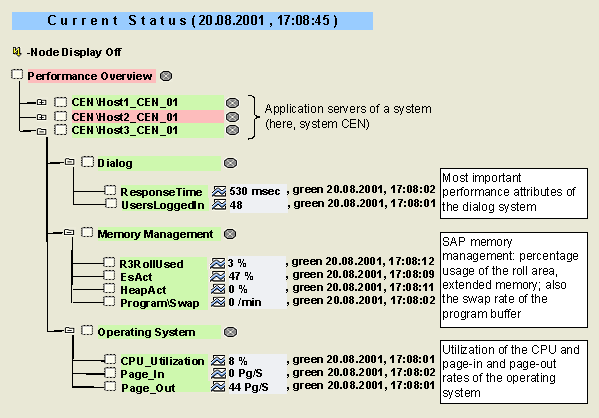
You can use the Performance Overview monitor to obtain the most important values about the performance of the application servers of your SAP R/3 System and to identify possible causes for performance problems. The various subtrees are taken from the following monitors of the SAP CCMS Monitor Templates monitor set:
Features
The following table provides information about the monitoring tree elements (MTEs) of this monitor:
|
MTE |
Description |
Additional Information |
|
ResponseTime |
Response time of the dialog service |
Dialog Overview Monitor |
|
UsersLoggedIn |
Number of users logged on |
|
|
R3RollUsed |
Usage of the roll area as a percentage. The roll area is a memory area of a fixed, configurable size that belongs to a work process; it contains user-specific data and is the first memory that a work process obtains. |
 SAP Roll Area SAP Roll Area |
|
EsAct |
Utilization of the extended memory as a percentage. The extended memory contains the largest part of the user context. The page management of this memory as a stack is performed not by the operating system, but directly by the SAP system. |
SAP Extended Memory |
|
HeapAct |
Utilization of the private memory as a percentage. A work process is only assigned private memory if the roll area and extended memory are occupied; the work process is then reserved for the current user context until the end of the transaction (PRIV mode). Performance problems occur if too many dialog work processes are running in PRIV mode. |
Private Memory |
|
Program\Swap |
Swap rate of the program buffer |
SAP Buffer |
|
CPU_Utilization |
Average utilization of the CPU on a host as a percentage |
Operating System Monitor |
|
Page_In |
Average number of page-ins per second |
|
|
Page_Out |
Average number of page-outs per second |
Activities
To start the monitor, follow the procedure below: