

 Exchange Infrastructure Monitor (Integration Engines)
Use
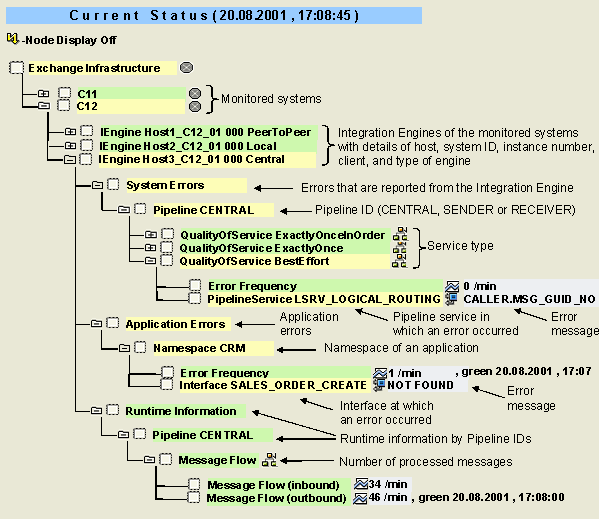
You can use this monitor to monitor the Exchange Infrastructure and to identify errors in the various pipelines and pipeline services of the Integration Engine.

In addition to the information about the monitored Integration Engines described here, the Exchange Infrastructure monitor also contains information about the
An Integration Engine processes XML messages to allow communication between applications in heterogeneous system landscapes. The processing of the messages is performed in a pipeline and usually includes mapping and routing. The following types of Integration Engines exist:
The XML messages come either from external applications through the HTTP adapter into an SAP component, or are generated locally by the application directly in an SAP component using a proxy interface. There is usually a local Integration Engine in the application server that forwards the messages to the central Integration Engine. The messages are processed there. On the other hand, with server-side routing and mapping, the functions of the central Integration Engine are available on an application server.
Prerequisites
The Exchange Infrastructure is not part of the standard delivery of the SAP Web Application Server 6.20. For more information about the Exchange Infrastructure, see its documentation.
Features
The following table provides information about the monitoring tree elements (MTEs) of this monitor:
|
MTE |
Description |
|
IEngine <Host>_<SysID>_<Ino> <Client> <EType> |
Integration Engine with information about Host, system ID (SysID), instance number (INo) and Client on which the engine is running; EType is the type of the Integration Engine |
|
System Errors |
Subtree with errors that are reported within the pipelines of an Integration Engine |
|
Pipeline CENTRAL |
ID for a pipeline of the central Integration Server that performs the actual message processing; this ID exists on Integration Engines of types PeerToPeer and Central |
|
Pipeline RECEIVER |
ID for a pipeline on the receiver side that calls the proxy interface; this ID exists on Integration Engines of types PeerToPeer and Local |
|
Pipeline SENDER |
ID for a pipeline on the sender side that the central Integration Server calls; this ID exists only on Integration Engines of the type Local |
|
QualityOfService ExactlyOnceInOrder |
Service type with asynchronous message processing; the processing is performed using  qRFC Queues that guarantee processing exactly once, in chronological order qRFC Queues that guarantee processing exactly once, in chronological order |
|
QualityOfService ExactlyOnce |
Service type with asynchronous message processing; the processing is performed using qRFC queues that guarantee processing exactly once |
|
QualityOfService BestEffort |
Service type with synchronous message processing |
|
Error Frequency |
Number of reported errors per minute, broken down by service types |
|
<Pipeline-Service>.... |
Name of the pipeline service for which an error occurred; then the error message itself |
|
Application Errors |
Subtree with errors that are reported within the applications that send or receive the XML messages through the Exchange Infrastructure |
|
<Namespace> |
Namespace of an application; depending on the naming convention, may be analogous to the name of the application |
|
Error Frequency |
Number of reported errors per minute, broken down by the namespaces of the applications |
|
<Interface> |
Name of the interface for which an error occurred; then the error message itself |
|
Runtime Information |
Messages during the runtime of the pipeline processing |
|
Message Flow Message Flow (inbound) Message Flow (outbound) |
Number of messages per minute, broken down by pipeline type, that are processed in a pipeline; the number of inbound and the number of outbound messages are displayed |
Activities
To start the monitor, follow the procedure below: