

 Exchange Infrastructure Monitor (qRFC Queues/Self-Monitoring)
Use
You can use this monitor to monitor the
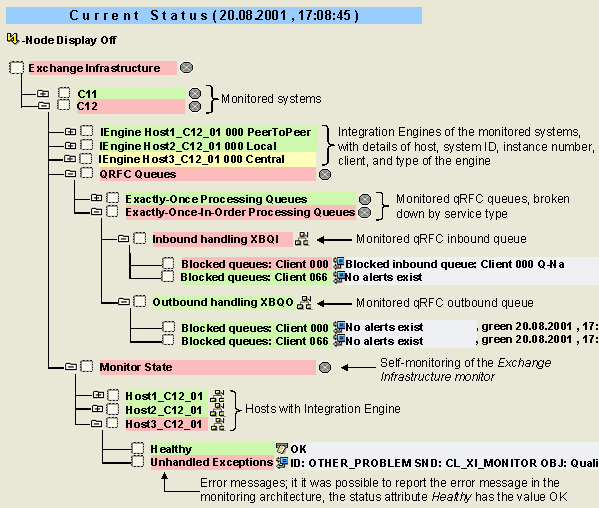
 qRFC queues that ensure, in the context of the Exchange Infrastructure, that the XML messages are processed exactly once and, if necessary, in chronological order. This monitor also contains self-monitoring for the Exchange Infrastructure monitor.

In addition to the information about the relevant qRFC queues and self-monitoring described here, the Exchange Infrastructure monitor also contains information about the monitored
An Integration Engine processes XML messages between different applications in heterogeneous system landscapes. The processing of the messages is performed in a pipeline and usually includes mapping and routing. Depending on the service type, the messages can be transferred using a central Integration Engine synchronously or asynchronously:
|
Service Type |
Description |
|
Best Effort |
Service type with synchronous message processing |
|
Exactly Once |
Service type with asynchronous message processing; the processing is performed using qRFC queues that guarantee processing exactly once |
|
Exactly Once In Order |
Service type with asynchronous message processing; the processing is performed using qRFC queues that guarantee processing exactly once, in chronological order |
The service type Exactly Once also uses qRFC calls (and not, as some might think,
transactional RFC calls). The chronological processing of the messages is not guaranteed with this service type, as not all XML messages for an application use the same queue.The self-monitoring of this monitor includes the messages from errors that are not caught by the monitoring architecture; the monitor also monitors the correct display of these messages.
Prerequisites
The Exchange Infrastructure is not part of the standard delivery of the SAP Web Application Server 6.20. For more information about the Exchange Infrastructure, see its documentation.
Features
The monitor contains the following monitoring tree elements (MTEs):
|
MTE |
Description |
|
QRFC Queues |
Monitored qRFC queues; for a general description of the monitoring of qRFC queues in the Alert Monitor, see Monitoring qRFC and tRFC Calls |
|
Exactly-Once Processing Queues |
qRFC queues of service type Exactly Once; this type with asynchronous communication guarantees processing of XML messages exactly once |
|
Exactly-Once-In-Order Processing Queues |
qRFC queues of service type Exactly Once in Order; this type with asynchronous communication guarantees processing of XML messages exactly once and in chronological order |
|
Inbound handling XBTI Outbound handling XBTO |
Inbound and outbound queues of the service type Exactly Once |
|
Inbound handling XBQI Outbound handling XBQO |
Inbound and outbound queues of the service type Exactly Once in Order |
|
Blocked queues: Client <No> |
Log attribute in which messages about blocked qRFC queues are reported, broken down by client |
|
Monitor State |
Subtree with the self-monitoring of the Exchange Infrastructure monitor |
|
Healthy |
Status attribute that has the value OK as long as the messages of the log attribute Unhandled Exceptions could be successfully reported in the monitor |
|
Unhandled Exceptions |
Messages about errors in the context of self-monitoring of the Exchange Infrastructure monitor |
Activities
To start the monitor, follow the procedure below: