Analyzing SQL Monitor Data in the Result View
Prerequisites
- To access the SQL Monitor recordings, you need the authorization profile for displaying SQL Monitor data. See also: Preparations
- The report RSQLM_UPDATE_DATA runs periodically (by default once per hour) in the relevant system. It makes the data collected by the monitor available for read access.
Context
- ABAP developers
- (AS ABAP system administrators)
Procedure
- To access the data selection screen of the SQL Monitor, launch transaction SQLMD (/SDF/ZQLMD for ST-PI version) or, alternatively, click the Display Data button in the initial screen of transaction SQLM (/SDF/ZQLM for ST-PI version).
- Specify options for data analysis - according to the desired view of performance data you want to focus on.
- Press F8 or choose the Execute icon in the toolbar.
Results
Based on the selection criteria, the SQL Monitor generates the result list, which is the starting point for your performance analysis. Depending on which option you have selected for the aggregation of SQL data, your result display will vary. On the basis of the aggregation, the result display cannot be fully displayed on one single level. The next drilldown of data can be displayed with the help of a further display level. So, with aggregation, we distinguish between the first and the second level of the result view.
Aggregation: By Source Code Position
With the aggregation option By Source Code Position, all SQL monitoring data records that belong to the same source code position (independent from the requests), are aggregated in one line in the result view.
In the first level of the result view, each line corresponds with one executed SQL statement.

The affected source code fragment (that triggers the SQL statement) is called normally from within different request entry points.
For a called code position, therefore, different request entry points are aggregated on the first level of the result display. However, to drill down a result view in the reverse direction according to request entry points, you will need to click on the link in the column Request Entry Point. This displays the second level of the result display.

Aggregation: By Request
With the aggregation option By Request, all SQL monitoring data records that belong to the same request entry point (independent from the source code position), are aggregated in the first level of the result list.

For any one request, all code positions that trigger an SQL operation are aggregated on the first level of the result display. A row corresponds to a request on the first level of the results display.
However, to drill down a result view for code positions in the reverse direction, you only need to click on the link in the DB Statements column. This triggers the display of the second level of the results with performance data for the respective code positions.
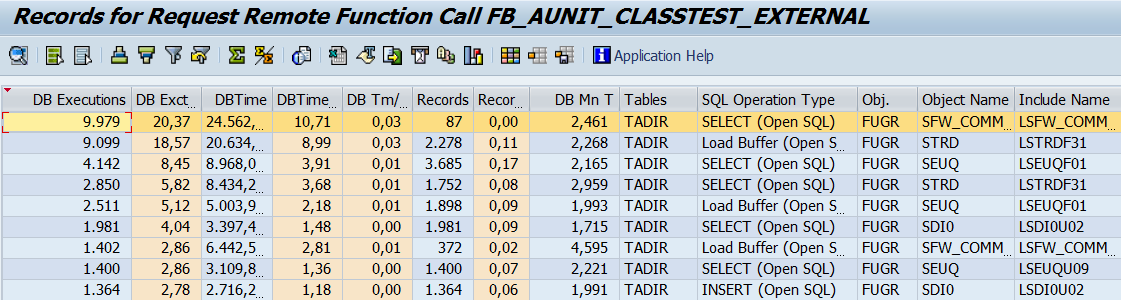
The fields Total Number DB Executions and the Total DB Time are the most important performance indicators. However, the other fields may also be very interesting for your analysis.
| Total DB Time [ms] |
The total elapsed DB execution time measured for an SQL statement.
Related indicators are:
|
| Total Time in Work Processes [ms] |
The complete execution time for an SQL statement The total time is the sum of the total DB time and ABAP execution time. |
| Total DB Time / Total Time |
The ratio Total DB Time / Total Time allows you to identify code that has the potential for SQL optimization. |
| Total DB Records |
The total number of database records is the sum of all records retrieved (read access) or modified (write access) by an SQL statement.
Related indicators are:
|
| Internal Sessions |
Number of different internal sessions in which the SQL statement was executed. Example: For a simple report (request type “Submit report”), the number of internal sessions equals the number of report executions. |
| Executions / Internal Session |
Average execution number of the SQL statements per session. High execution/session values are often an indication of a nested SELECT. |
The fields Object Type, Object Name, Include Name, Include Line, Program Name, or Processing Block provide you with additional semantic information concerning the program context.
If you are using the time series mode for displaying data results, you can drill down the result view for each selected data record (for example: a request) by clicking the Display Time Series button.
See also: Specifying Options for Data Analysis > case e.
 with time series selection")
This triggers the display of the second level of result view with the performance data for the specified time period.
