 Threshold Value Analysis
When using the threshold value analysis, specify a threshold value for a key figure and an operator for the threshold value.
You can perform a forecast where you can determine whether a specified threshold value will also be achieved in the future based on the present actual data, leaving sufficient time for you to react to undesirable events.
The number of periods that are to be forecasted are defined by you. The forecast is carried out based on historical data.
For every requirement, you can specify whether a check should be done for the individual periods. If this option is selected, every period will be individually checked with regard to the requirement.
 Note
Note
Note that in a forecast, the number of periods that you specify under the period to analyze is the one to be used for the forecast. If you have selected two periods, for example, as the period to be analyzed for the exception, this indicates that these two periods will be the basis for the forecast. You also need to specify the number of forecasting periods (
No. of forecast periods
). This is the number of periods for which a forecast, based on the actual data, will be done. If you specify five, for example, this indicates that based on two periods in the past, a forecast for five periods will be made in the future.
The following representation illustrates the threshold analysis with and without a forecast.
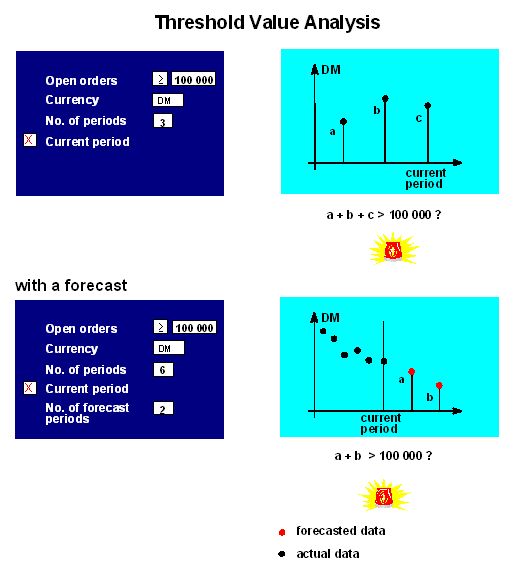
Example: Threshold Value Analysis
Procedure:
Position the cursor on the key figure for which you want to define or change requirements for a trend analysis and select

Edit

Define: Requirement.

A dialog box appears.
Select
Threshold analysis
and pressEnter.
A dialog box appears.
In the field behind the selected key figure, specify first the operator and then the threshold value.
You can get a list of possible operators by using the possible entries key.
To check whether a threshold value was reached in the future, based on actual data, you can perform a forecast. The forecasted data is determined based on actual data.
If you want to check a period of time in the future, whether a certain threshold value will be reached, specify the number of periods for which the forecast is to be done based on actual data, in the
No. of forecast periods
field. In this case, the actual data for the number of periods are read that were specified in the exception header (No. of periods
field) and based on this actual data a forecast is created for the desired number of periods.
Note that with the forecast the threshold value refers to the number of forecasting periods; the number of periods for the analysis time period serves as a basis for the forecast.
If you do not want to carry out a forecast, you do not need to make any entries in the
No. of periods
field.If you want to check the requirement for each individual period, select the field
Individual period.
If this field is not selected, the values for the number of periods that were specified in the exception header
(No. of periods
field) will be cumulated and checked against the requirement.In the forecast, the forecasted values are cumulated for the number of forecasting periods and checked against the requirement.
PressEnter.
Threshold value and operator are shown behind the selected key figure.