Custom Graphics
You can upload custom graphics for use in Customer journey maps, Value chains, BPMN 2.0 diagrams and navigation maps. Uploaded files must be in SVG format. SVG images are vector-based, which means they can scale to any size without losing quality. In contrast, formats like PNG are raster-based and can become pixelated when scaled up. SVG images have smaller file sizes compared to PNG images, allowing for faster loading times on web pages. Additionally, SVG images offer more flexibility and customization options, as they can be easily manipulated and animated using CSS and JavaScript. By using the SVG format for images, websites and other digital platforms can achieve better performance and visual quality.
The following elements can be customized:
BPMN 2.0 diagrams
-
IT System
-
Additional Participant
-
Data object
Value chains
-
Process
-
Collapsed process
Customer journey maps
-
Persona
-
Touchpoint
-
Moment of truth
-
Customer
-
Decoration
Navigation maps
-
Images
Custom graphics are tied to the workspace to which they are uploaded. If you have multiple workspaces and want to use custom graphics in each, you must upload them separately to each workspace.
Upload Custom Graphics
Follow these steps:
-
Create or save the image you want to use as an SVG file.
-
In the SAP Signavio Process Manager explorer, open
 Setup
Setup  Define notations/attributes
 .
.The Define notations/attributes dialog opens.
-
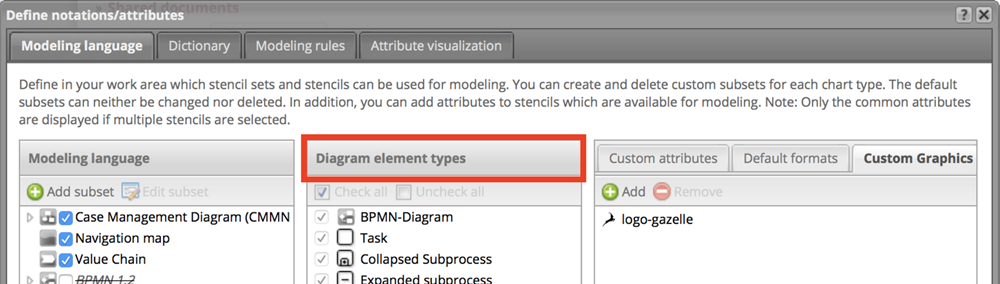
In the Modeling language section, select either customer journey map, value chain, BPMN 2.0 diagram, or navigation map.

-
In the Diagram element types section, select the element type you want to set the custom graphic for. Note that not all elements can be customized.
-
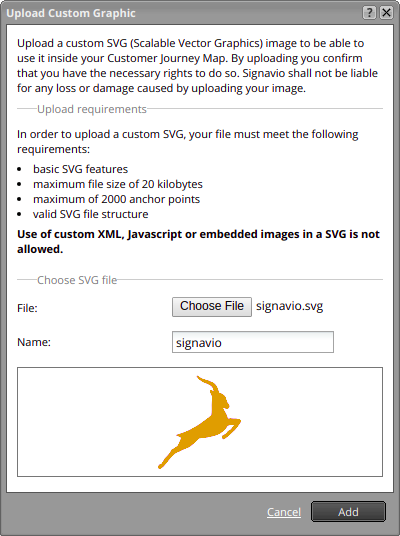
In the Custom attributes section, select the Custom Graphics tab. Select the Add button. The Upload Custom Graphic dialog opens, with details about the upload requirements for SVG files.

-
Select Choose File and choose the file you want to upload. The Name field is prefilled with the file name. A preview of the image is displayed. Edit the name if needed, and select Add.
-
SAP Signavio Process Manager performs a validation while your file uploads, to make sure it fits all requirements (see section Validation criteria below).
-
If the validation is successful, your custom graphic is displayed in a list in the Custom Graphics tab.
-
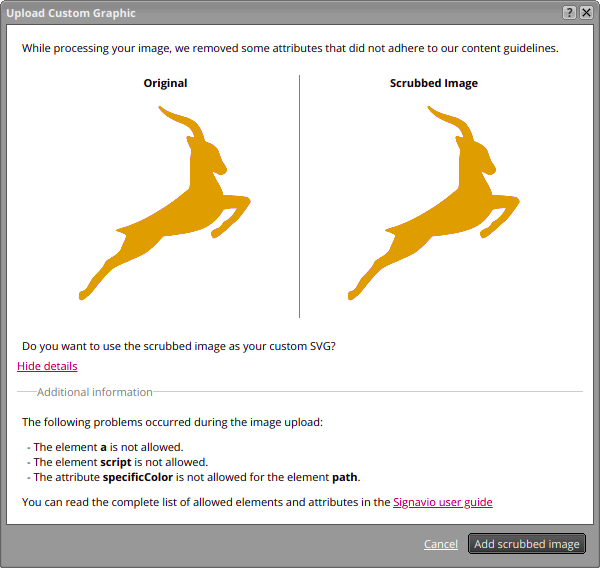
If the validation fails, a dialog shows you the original image and what the image will look like after being scrubbed. If the scrubbed image is fine, choose Add scrubbed image.
-
If the validation fails, it may also be that the uploaded SVG does not meet our requirements.
-
Your custom graphic is displayed in a list in the Custom Graphics tab, where you can now set and use it for modeling.
Delete Custom Graphics
Follow these steps:
-
In the SAP Signavio Process Manager explorer, open Setup > Define notations/attributes.
The Define notations/attributes dialog opens.
-
In the Modeling language section, select either customer journey map, value chain, BPMN 2.0 diagram, or navigation map.
-
In the Diagram element types section, select the element type from which you want to delete the graphic.
-
In the Custom attributes section, select the Custom Graphics tab. Choose Remove.
-
Confirm in the dialog. The graphic is deleted from the workspace and no longer available in any diagram.
Validation Criteria
SVG is a flexible, powerful file format. However, this flexibility makes it vulnerable to security exploits. To prevent possible security problems, SAP Signavio Process Manager will check each SVG file you try to upload and scrub anything potentially malicious from the file. It will then show you a preview dialog, so you can see the differences between the original and scrubbed file. If the scrubbed file is acceptable to you, you can then continue with the upload.
The requirements for SVG files are:
-
The root element of the SVG must contain the required attributes either width and height or viewBox. The width and height attributes must be absolute size.
-
The attributes of the SVG file must not contain JavaScript in attributes
-
The elements and attributes of the SVG file must not contain URLs
-
The SVG file must not exceed the supported complexity of 2000 anchor points
Here is the list of allowed tags and attributes for SVG files:
Tags: "svg", "style", "g", "path", "ellipse", "circle", "polygon", "rect", "line", "polyline", "defs", "clipPath", "mask", "use", "radialGradient", "linearGradient", "stop"
Attributes: "version", "xmlns", "xmlns:svg","xmlns:xlink", "xlink:href", "xlink:type", "xlink:actuate", "xlink:show", "viewBox", "zoomAndPan", "xml:space", "contentStyleType", "contentScriptType", "preserveAspectRatio", "id", "class", "name", "style", "transform", "d", "points", "x", "x1", "x2", "y", "y1", "y2", "cx", "cy", "r", "rx", "ry", "width", "height", "fill", "fill-opacity", "fill-rule", "opacity", "offset", "stroke", "stroke-width", "stroke-opacity", "stroke-dasharray", "stroke-miterlimit", "stroke-dashoffset", "stroke-linecap", "stroke-linejoin", "type","clip-path", "mask"
Modeling with Custom Graphics
Once uploaded, custom graphics can be used in customer journey maps, value chains, BPMN 2.0 diagrams and navigation maps.
To use custom graphics in a model, follow these steps:
-
Open an existing diagram, or create a new one.
-
Select an element you have defined a custom graphic for.
-
In the Attributes panel under Main Attribute, select the arrow next to the Image field.
-
Select your custom graphic from the drop-down menu.
Your element changes from the default graphic to the custom graphic you defined.