
 Enabling the Availability Monitoring of the PMI
Service
Enabling the Availability Monitoring of the PMI
Service

Use
Use this procedure
to set up and start GRMG availability monitoring of the PMI Service in the
J2EE Engine. The PMI Service is necessary in order to use the
 SAP Process Monitoring
Infrastructure from within the J2EE engine. The PMI Service
collects the data from PMI Java agents and sends them to the central
monitoring system.
SAP Process Monitoring
Infrastructure from within the J2EE engine. The PMI Service
collects the data from PMI Java agents and sends them to the central
monitoring system.
Prerequisites
· An installed and running J2EE Engine
· The central monitoring system has to be an SAP Web AS ABAP 6.40.
·
The SAPCCMSR agent
with the option – J2EE has to be registered and active at CEN. Information how to register the SAPCCMSR Agent can
be found under
Installing an Agent on
a Java Instance (Java Standalone System).
· Since the PMI Service collects the data from PMI Java agents and sends them to the central monitoring system, an HTTP destination named pmistore has to be created in the Destinationsservice of the J2EE Engine. The URL is http://<host>:<port>/sap/bc/spi_gate, where <host> and<port> are the host and HTTP port of the IC manager of the monitored system.

Currently only XI uses the service, and the HTTP destination should be created when the XI Adapter Framework is configured on the J2EE engine. For XI Process Monitoring, the destination is therefore created automatically.
Procedure
...
1. In the Visual Administrator, choose Cluster → Server →Services → Monitoring → GRMG Customizing tab to list the applications that have a deployed GRMG customization.
2. Select sap.com/com.sap.pmi.adm.
3. In the Customizing tree for application pane, select the scenarios → scenario → scenstarturl tag (the Edit option on the toolbar becomes active) and enter a correct hostname and port for the instance of the J2EE Engine. The hostname is the name of the machine your J2EE Engine is running upon, for example http://10.00.74.00:50000/pmi/grmg.
4. For the tags scenname and scendesc (under scentexts → scentext) the values pmi and PMI Heartbeat are inserted by default.
If you want to monitor more than one PMI service, you have to specify different scenario instances under scenstarturl.
5. Choose Save.
The changes made to the configuration are stored in the database.
6. Choose Upload to upload the XML file to the CCMS agent.
At the time of deployment, the XML file is validated according to the GRMG DTD. If the validation passes successfully, the file is stored in the database of the central monitoring system. After at most an hour, you should be able to see the availability data of the PMI service in your central monitoring system. See the ‘Results’ section below.
If the validation fails, an error message is displayed prompting you to rewrite your tags according to the GRMG specification. The name of the file in which the configuration is stored must start with the string “GRMG_” if it is be noticed by the agent. The directory in which these files are stored is: /usr/sap/temp/grmg for UNIX systems and $SAPLOCATION\prfclog\grmg for Windows.
Results
You can monitor the availability of the PMI Service in the CCMS Alert Monitor (Transaction RZ20) in the monitor template SAP Process Monitoring Infrastructure → PMI Selfmonitoring.
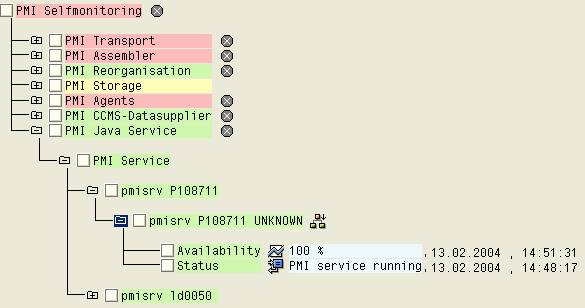
For more details
see
CCMS Monitor for
Self-Monitoring of the Process Monitoring.
It can take up to one hour from the upload of the XML file until the monitored availability data is shown in the CCMS Monitor, because an hourly report informs the agent of the GRMG scenario. You can check if the XML file was uploaded by starting Transaction GRMG in the central monitoring system.
See also:
Availability Monitoring of the J2EE Engine