
 BusinessGraphics Properties

Properties in the View Designer
● backgroundColor
Background color of the BusinessGraphics UI element.
● categorySource
Path to the context node in the hierarchical structure of the context that provides the data for the category.
● chartType
See
 Chart
Types
Chart
Types
Value |
Description |
area |
Area chart |
bars |
Bar chart |
columns |
Vertical bar chart |
delta_chart |
Delta chart |
doughnut |
Doughnut chart |
gantt |
Gantt chart, see also UI Element BusinessGraphics (chartType gantt) |
histogram |
Histogram |
lines |
Line chart |
mta |
Milestone trend analysis chart |
pie |
Pie chart |
pipeline |
Pipeline type chart |
polar |
Polar type chart |
portfolio |
Portfolio type chart. This chart type can be used as an analytical tool in strategic corporate planning. It can be used to provide a visual display of a company’s competitiveness, for example. |
profiles |
Profile chart |
profile_area |
Profile area chart |
radar |
Radar chart |
scatter |
Scatter chart |
smart_map |
Smart map |
speedometer |
Speedometer chart |
split_pie |
Split pie chart |
stacked_area |
Stacked area chart |
stacked_bars |
Stacked bar chart |
stacked_columns |
Stacked vertical bar chart |
stacked_lines |
Stacked line chart |
stacked_profile_area |
Stacked profile area chart |
stacked_profiles |
Stacked profile chart |
stacked_radar |
Stacked radar chart |
stacked_time_bars |
Stacked time bar chart |
stacked_time_columns |
Stacked time column chart |
time_bars |
Time bar chart |
time_columns |
Time column chart |
time_scatter |
Time scatter chart |
● customizing
How the
graphic is displayed on the screen. This property is assigned to a Web address (URL)
linking to an XML file that describes the appearance of the business graphic
on the screen – for example, the graphic color, the background color,
fonts, and so on. It also specifies whether or not the graphic displays a
legend.
You can also make these settings
directly in the View Designer using the Chart Designer tool.
To call this tool, place the cursor on
the UI element, click the secondary mouse button, and select Edit
Customizing in the context menu. See also Chart Designer
Integration.
The BusinessGraphics properties
dimension and fontFamily are provided by the meta model itself. They overwrite
the customizing settings if they differ.
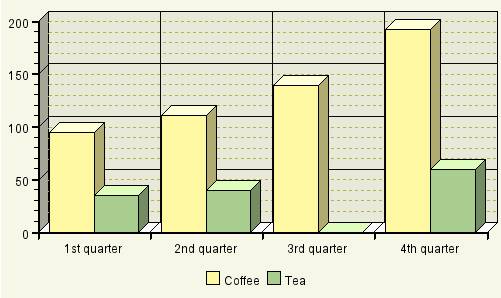
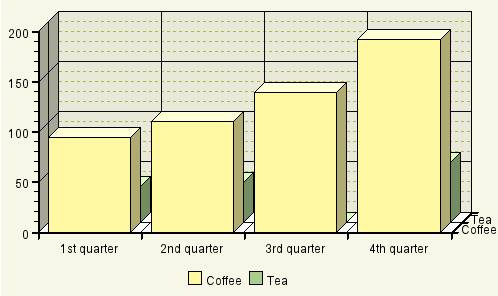
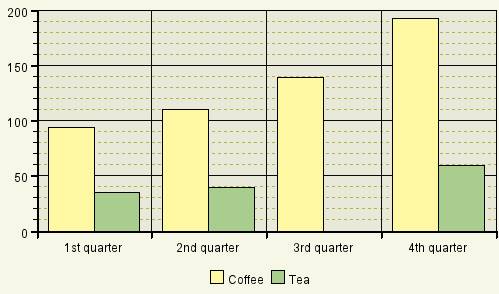
● dimension
Chart dimensions.
Value |
Visual Display |
Description |
pseudo_three |
|
Pseudo three-dimensional chart in which the X axis is not visualized |
three |
|
A real three-dimensional chart |
two |
|
Two-dimensional area chart |
● fontFamily
Font type used by the graphic elements.
● height
Height of the interface element, specified in CSS sizes, such as em, ex, pixel, or percent. See also Methods and Properties of UI Elements.
● igsUrl
Web address (URL) of the server on which the Internet Graphics Service is to run.
● seriesSource
Path to the context node in the hierarchical structure of the context that provides the data for the Series or SimpleSeries.
● transparentColor
Color to be used as the transparent color. You can specify the colors in RGB, HSB, or X11 - for example, rgb(255,0,0), or slate blue.
● width
Width of the interface element, specified in CSS sizes, such as em, ex, pixel, or percent. See also Methods and Properties of UI Elements.