
 Sending an IDoc through XI Failed

Problem Description
An application sent an IDOC through XI. The respective message did not arrive at the receiver system.
Example Scenario
Example Scenario
An application sent a message through XI. The message was sent as an IDoc and the IDoc number is known. The message should have been transformed on the Integration Server into an XI message, sent to the file adapter and stored on the file system from which a non-SAP application picks it up.
|
Scenario Type: |
Error analysis |
|
NetWeaver Component: |
XI 3.0 |
|
Validity: |
≥ XI 3.0, SP6 |
Possible Error Causes
● Faulty configuration in XI Directory, such as incorrect routing
● Faulty technical configuration of XI, such as the IDOC adapter is not properly configured
● Problems in underlying technologies, such as the file system is full
Decision Roadmap
Prerequisites
Main Tools
XI Runtime Workbench
Transactions:
● IDX1
● IDX5
● SXMB_MONI
● SM58
● SM21
Analysis
For an overview of analysis steps see the flow chart.
Flow Chart
...
1. Gather information about the failed IDoc/message
In this step you need to get the relevant information to “trace” the document through XI, that is, to find out the path the failed document took from sender to receiver.
Let us assume that the initial information includes the sending system SID, the time the IDoc was sent, and the sending message type.
2. Find the location of the failure
Try to find out in which XI component the error occurred. Candidate components depend on the scenario used. The standard scenario involves a sender system, the integration server (IS) and a receiver system. Basically, there are two ways to find out in which system the error occurred: Use the end-to-end monitoring, or search through the systems step-by-step beginning with the sender, then the IS and finally the receiver system using the individual monitoring tools.
Here we describe the individual monitoring (step-by-step approach), in other words, we successively inspect the component-based monitoring tools from sender through integration server, adapter engines to the receiver. The analysis starts with the sender system and proceeds towards the receiver. In the scenario described here, this process begins with checking the IDoc status in the sender.
3. Check the IDoc status on the sender
Call transaction WE05, either set an appropriate time frame or enter the IDoc number to see if the IDoc was sent.
After you make a selection you see the following screen. Here you can see that there were a couple of IDocs that have not successfully been passed to the TRFC handling. In such cases, see the IDoc Interface documentation for further analysis.
If transaction WE05 says that the IDoc handling was successfully passed to TRFC (status 03), look in transaction SM58 of the sender for errors of function block IDOC_INBOUND_ASYNCHRONOUS. For instance, you may find here the following entries:
|
Function Module: |
IDOC_INBOUND_ASYNCHRONOUS |
|
Target System: |
<destination> |
|
Date: |
03.01.2004 |
|
Time: |
14:02:22 |
|
Status Text: |
Transaction IDX1: Port <port>, Client <client>, RFC destination contains errors |
The following are possible error causes on the receiver:
● Port/client not assigned to an RFC destination.
○ Call transaction IDX1 and check that an RFC destination is maintained for the port <port> and the client <client>.
○ For IDocs that are sent from SAP systems, the port is assembled from the prefix SAP and the SID of the SAP system.
○ Check whether the RFC destination has been entered correctly.
● The RFC destination contains errors (for example, the user does not have required authorizations).
Use transaction SM59 to check the RFC destination.
Initial screen of transaction WE05
Transaction WE05 search results
Errors caused by wrong IDOC configuration on IS
If the IDoc adapter is not properly configured on the integration server, these errors become visible on the sender system. Check transaction SM58 for failed IDoc function blocks. In case of authentication or authorization errors, you may also find information in the system log (transaction SM21).
Possible errors:
● Destination for reading meta data not defined in IDX1
● Reading of IDOC meta data by IS failed due to authentication, authorization or other technical problems
4 Check XI Message on Integration Server
If the IDoc arrived at the IS, it is transformed into an XI message. Hence failures are always visible in the message monitor. The message monitor can be accessed through SAP GUI (transaction SXMB_MONI) or Web browser (XI Runtime Workbench).
If you know already that the integration server is the location where the message failed (by having used the end-to-end monitoring for locating the error-causing system) you may skip section 4.1.
Port definitions
4.1 Determine whether the error occurred on IS
Check IDoc in IDX5
Log on to the XI system and check the inbound queue to see if the IDoc was received. For this purpose, use transaction IDX5. You must enter the time frame of when the IDoc was sent. In the figure below you can see the output of transaction IDX5.
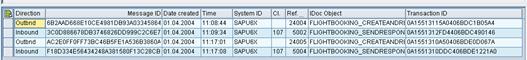
Transaction IDX5
MessageIDis the GUID of the XI system for this particular IDoc. The IDoc number is the IDoc number as stored by the Integration Server. Transaction ID is the transaction ID which is used in the sending process of the IDoc.
Check associated message in SXMB_MONI
When you double click the entry in IDX5, you come to SXMB_MONI where you see details of the faulty message. See section 4.2 for how to proceed further.
4.2 Find error cause
Open the detail view of the faulty message. There are different ways to display the detail message view:
● Navigate directly from end-to-end monitoring
● Navigate through the message list, then select the faulty message. In the detail view, inspect the error header of the message.
In the example above, you can see an error code (OUTBOUND_BINDING_NOT_FOUND), with explanatory text:
No receiver agreement found for sender INLD50033057,PIP0C2_R0102_Responder and receiver U6X,PIP0C2_R0102_Initiator,http://sap.com/xi/RosettaNet/PIP0C2_R0102,AsynchronousTestConfirmationAction
So when there are errors in the Integration Engine, this information can help you to find problems. Typical error categories are sketched in the subsequent chapters.
Message details on the Integration Engine
4.2.1 Configuration Error
4.2.1.1 Error in inbound processing
No business systems are defined in the SLD for the sending system ID and client. As a consequence, the transformation of the IDoc to the XI message failed.
4.2.1.2 Routing error
If the receiver of a message cannot be determined, this may have two causes:
○
The definitions in the XI directory are inconsistent
or incomplete.
Example: For a given set of message header information, no receiver
determination has been defined. Then this message cannot be delivered. This is
also the case if the physical address information is undefined or wrong (wrong
URL, wrong user).
○
The technical base configuration is wrong.
Example: The target business system used in a receiver determination is not
defined in the SLD, or the user for logging on to the target system does not
have the required authorizations.
You find the receiver determined by the Integration Server in the element <SAP:RECEIVER> of the main header. The addressing information is computed in the pipeline step Technical Routing and entered in the header OutboundBinding.
The following are typical routing error situations:
○
No outbound binding found.
Correction: Define an outbound binding for this message in the XI directory.
Restart the message.
○
No receiver agreement found.
Correction: Define receiver agreement in the XI directory. Restart the
message.
○
Wrong physical address.
After successful execution of the pipeline step Technical
Routing, the message header OutboundBinding
specifies the technical address in the element ChannelAttributes. The physical address may be specified by
means of an SM59 destination, or by defining the target URL directly in the
header. In the former case, open transaction SM59 and check the destination
specified. In the latter case, check whether the attributes in the header
define a valid target address.
Receiver determination
4.2.1.3 Mapping error
See problem analysis scenario Mapping Fails for a Certain Message Type.
4.2.1.4 Problem with cache update
Reload cache, see problem analysis scenario Mapping Fails for a Certain Message Type.
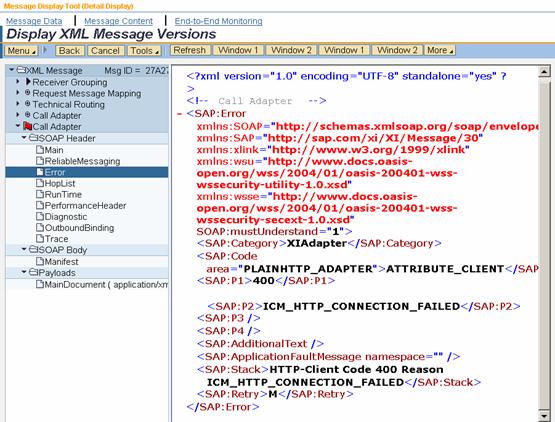
Sample communication error
4.2.1.5 Outbound Adapter
Here, the relevant pipeline step in the message monitor is call adapter. A number of HTTP communication errors may occur. See the HTTP documentation on error codes for further analysis of the problem cause.
Depending on the specific error code, you may have to check the address that has been determined in the pipeline step Technical Routing and can be found in the outbound binding. Check whether the address points to the intended receiver (in our scenario, the intended receiver is the adapter engine) and that the authentication data are valid. If the outbound binding refers to a SM59 destination, you can test the connection by means of transaction SM59.
In the case of authentication or authorization errors (HTTP error codes 401, 403), make sure that the user and password are defined on the receiver (on the adapter engine), and that the user has the proper role (the user needs to have the role SAP_XI_IS_SERV_USER_MAIN).
4.2.1.6 Low-level technical problem
Possible error causes are: Wrong message format, code page not available. In this case you have to analyze further with technical experts.
4.2.2 Check integration server queues whether message is stalled
If the message that has not yet been delivered is not in error state, the problem cause is probably that the message is blocked in the QRFC queues of the Integration Engine.
Check queue status
Call the Integration Server and call transaction SMQR in the sender and receiver Integration Engine in the corresponding system client.
Check the status of the scheduler and the status of the XBQ* and XBT* queues:
● Inbound qQueues
XBTI* (ExactlyOnce)
XBQI* (ExactlyOnceInOrder)
● Outbound queues
XBTO* (ExactlyOnce)
XBQO* (ExactlyOnceInOrder)
● Acknowledgment queues
XBTB* (ExactlyOnce)
XBQB* (ExactlyOnceInOrder)
● Large message queue
XBTL* (ExactlyOnce)
If the scheduler has the status Waiting, it is waiting for free work processes. This is why delays occur when XML messages are processed.
If not all necessary queues are registered, you can search for queues with the name prefix above using transaction SMQ2. Use transaction SXMB_ADM to register the queues in this case.
Check queue configuration
For a complete analysis, make sure that the queues of the integration server are registered. To do this start the transaction for the Integration Engine administration (SXMB_ADM) and select the function manage queues.
5 Check Message on Adapter Engine
See problem analysis scenario Message Failed on the Adapter Engine.
Additional Information