
 Performance Analysis with Single Message

Problem Description
Processing of an XI message takes long in specific pipeline step.
Example Scenario

During a GoingLive Optimization Session for an SRM scenario, an invoice is send from an SUS System to an MM backend via XI as a pre-production test. A standard SAP scenario SUS2MM is used for the interface. The total response time of the business process is more 2,3sec, which is not acceptable for the customer, since the business process is time-critical and has a high volume.
Scope
Component: XI 3.0, Validity: ≥ XI 3.0, SP1
Used Tools: SXMB_MONI, Performance Header Display, Visual Administrator, Jarm Statistics
Verification of Symptoms
Start SXMB_MONI, select the particular XI message and go to the performance header. Pipeline step PLSRV_MAPPING_REQUEST is longest pipeline service.
Possible Error Causes
● Bad mapping algorithms
Analysis Overview

Analysis Details
In a pre-production system a single message of a specific type can be tested by sending it separately and looking at the response time within XI.
Message monitoring (SXMB_MONI)
Log on to the integration server and call transaction SXMB_MONI: Monitor for processed XML messages.
A selection for the messages in status ‘Processed Successfully’ during the last hour is done.

In the list of messages displayed, you can identify your message e.g. by the sender, receiver or time stamp. Select it with double-click and you can take a look at the message content.
Performance Header
Choose the latest ‘Performance Header’ from the tree on the left hand side and take a look at the soap header on the upper window on the other side.
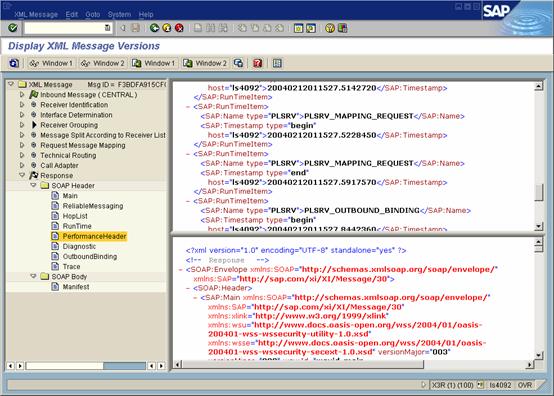
By comparing the time stamps given in the format <YYYYMMDDHHMMSS.msec> for all pipeline steps, one can find the step with the longest time.

In this example the mapping step takes most of the time.
You have to know the overall Xi architecture now, to find the next analysis step. The Mapping Request is the only step that is processed within the Java part of the WebAS. Therefore any further analysis has to be down with java monitoring tool.
Performance monitoring in the J2EE Engine
Launch the J2EE Visual Administrator by executing the go.bat in path \usr\sap\<SID>\DVEBMGS<System_number>\j2ee\admin. You will see the cluster configuration in the tree on the left hand side.

Choose the relevant server node. Then expand ‘Services’ and choose ‘Application tracing’ and the tabulator ‘JARM’. To display any data, you always have to click on the refresh icon.