
 Chart
Chart

Definition
A control to visualize data in annotated diagrams.
● axisMaxVal
Used to calculate the annotation and scaling of the chart. 'axisMaxVal' specifies the maximum value the axis is annotated with. If 'axisMaxVal' is not specified or a value is specified that is less than the maximum value provided by he model, 'axisMaxVal' is set to the maximum value of the model.
● axisMinVal
Used to calculate the annotation and scaling of the chart. 'axisMinVal' specifies the minimum value of the axis. If 'axisMinVal' is not specified or a value is specified that is greater than the minimum value provided by he model, 'axisMinVal' is set to 0.
● chartType
Controls the style in which the data is displayed.
○ AREA
○ AREA3D

○ AREA_STACKED

○ AREA_STACKED_3D
○ BARS

○ BARS_3D

○ BARS_STACKED

○ BARS_STACKED_3D

○ BITMAP
○ COLUMNS

○ COLUMNS_3D
○ COLUMNS_STACKED

○ COLUMNS_STACKED_3D
○ LINES

○ LINES_3D

○ PIE

○ PIE_3D

○ PIE_EX

○ PIE_EX_3D

○ PIE_SPLIT
○ PYRAMID

○ TREND

● colorOrder
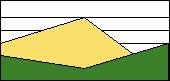
The various types of the chart control all use the same set of colors to visualize the values of a data set, but explore the space of possible colors on different paths. The following pictures show the three predefined color schemes and the chart types using them.
○ STRAIGHT
This color scheme is used by the various area, column and bar chart graphs.
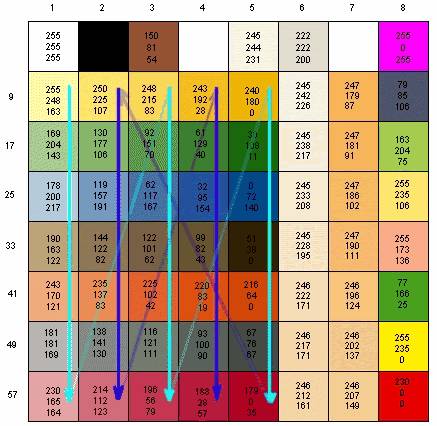
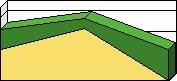
○ SNAKE
This color scheme is used by the pie chart graphs.

○ REVERSE
This color scheme is used by the line chart graphs.

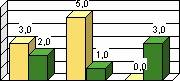
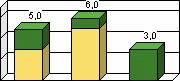
● displayObjectValues
A boolean value that controls if the values is displayed with the object.
displayObjectValues=”false” 
displayObjectValues=”true”

Not all 'ChartType' settings support the display of values. The example pictures in the 'chartType' attribute description show which types support the display of values.
● height
Defines the overall height of the chart. The height includes the 'title', 'titleValues' and 'legendPosition'.
● id
Identification name of the chart.
● legendPosition
Controls the position of the legend.
○ EAST
Places the legend on the right side of the chart.
○ NONE
The legend will be suppressed.
○ NORTH
Places the legend on top of the chart.
○ SOUTH
Places the legend under the chart.
○ WEST
Places the legend left of the chart.
● model
Defines the model which provides the chart with data. How to work with the IChartModel.
● title
Specifies the headline of the chart.
● titleCategories
Specifies the axis title for the categories.
● titleValues
Specifies the axis title for the values.
● visible
A boolean value that defines if the chart is visible.
● voidValue
Defines a value that will not be drawn in the chart. Is a "voidValue" set, for example to 0, chart objects with the according voidValue will not be drawn.

Line charts do not support this option.
● voidValueSet
Switches the "voidValue" function on and off.
● width
Defines the width of the chart. The width include 'titleCategories' and the 'legendPosition'.
Attributes |
M |
Values |
Usage |
axisMaxVal |
|
Numeric
|
Taglib Classlib |
axisMinVal |
|
Numeric |
Taglib Classlib |
chartType |
|
AREA |
Taglib Classlib |
colorOrder |
|
DEFAULT (d) |
Taglib Classlib |
displayObjectValues |
|
FALSE (d) |
Taglib Classlib |
height |
|
Unit (200) |
Taglib Classlib |
id |
* |
String (cs) |
Taglib Classlib |
legendPosition |
|
EAST |
Taglib Classlib (ChartLegendPosition.SOUTH) |
model |
|
Component |
Taglib Classlib |
title |
|
String |
Taglib Classlib |
titleCategories |
|
String |
Taglib Classlib |
titleValues |
|
String |
Taglib Classlib |
visible |
|
FALSE |
Taglib Classlib |
voidValue |
|
Numeric – Double |
Taglib Classlib |
voidValueSet |
|
FALSE |
Taglib Classlib |
width |
|
Unit (500) |
Taglib Classlib |
Example
using the taglib
<hbj:chart |
using the classlib. For information about setting up the bean, see "IChartModel".
Form form = (Form)this.getForm(); |
Result
