Calling the Chart Designer

You can use the Chart Designer to modify the properties of a business graphic and adapt them to your needs. Modifying the graphical elements in the overview, for example, lets you test and find chart types that may be more effective.
The Chart Designer is divided into three areas:
● The graphics preview
The area on the left-hand side in which the business graphic is displayed. This area is used to display a preview of the Customizing settings. Changes to these settings are displayed immediately in the graphics preview, which lets you implement necessary changes in the business graphic display instantly.
● Overview of graphical elements
The area in the upper-right side that contains the list of graphical elements. Each graphical element, in turn, has one or more properties. To change a property, select a chart element either from the chart window or by name in the chart element window. The properties of the chart element are then displayed, and you can edit and change the values of the properties.
● The property list
The properties are listed in the area below the graphical elements. To change a property, select a graphical element either with the mouse in the graphics preview or from the overview of graphical elements. The properties of the graphical element are then displayed. You can change the values of these properties.
Prerequisites
You first have to insert a BusinessGraphics UI element into a view. Only then can you start the Chart Designer through the context menu for the BusinessGraphics UI element.
Procedure
To edit the properties of a BusinessGraphics UI element , start the Chart Designer as described in the following:
...
1. You start in edit mode of the view where you inserted the BusinessGraphicsUI element.
2. To start the Chart Designer, choose Edit from the context menu for the BusinessGraphics UI element in the outline window.
3. The Chart Designer opens in a separate window in the SAP NetWeaver Developer Studio.
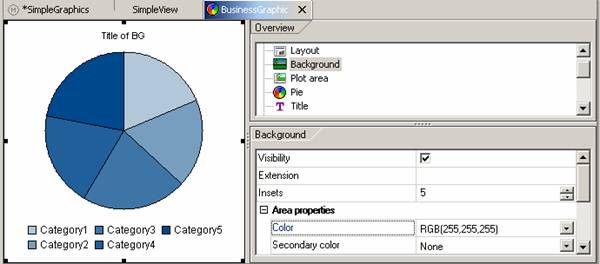
4. Select the graphical element you want to modify – either directly with the mouse button in the graphics preview or from the overview of graphical elements.
5. Enter the desired properties and values, such as the color. You can use either RGB values or hexadecimal values for the color. The business graphic then appears with the modified values in the graphics preview.
6. To update the data, save the changes.

Part of the graphical element represents properties of the Business Graphics UI element. These are, for example:
■ BackgroundColor
■ Chart type
■ Dimension
■ FontFamily
■ TransparentColor
These properties are assigned default values when you create the BusinessGraphics UI element. You can assign new values to these properties (graphical elements) immediately in the property window of the UI element.
When you define new values for these UI element properties (= graphical elements) in the Chart Designer, these new values overwrite the values of the UI element properties when you save the metadata.
Changing the Properties of a Graphical Element
You want to change the background color of your business graphic:
...
1. Start the Chart Designer from the context menu of the BusinessGraphics UI element in the outline window of the view.
2. Select the corresponding graphical element such as Background, from the overview. The corresponding graphical element properties are displayed.
3. To change the background, choose property Color from the list of properties in group Area properties.
4.
To change
the value of the color, enter the desired RGB value in RGB(255,255,255) or a
hexadecimal value (#FFFFFF) for “White” or select a color with the
mouse button in the color palette by pressing the  button.
5.
If you enter
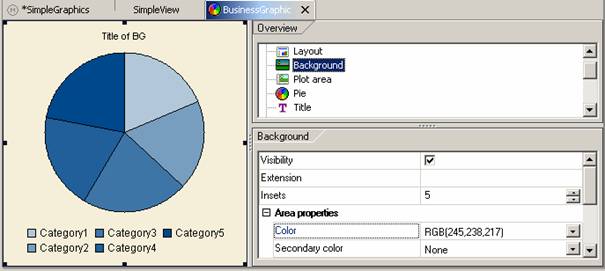
the RGB color RGB(245,238,217), for example, the business graphic is displayed
with a beige background (see the screenshot below).