Examples for CALCULATED MEMBER
Examples for CALCULATED MEMBER
to define newfor special functions, depending on existingofand.:
- Calculate formulas (example 1)
- Filter using multiple values (example 2)
- Calculate the linear regression (example 3)
Example 1
Use Calculated Member to:
- Create formulas ad hoc,
- in which you can use expressions that are not key figures,
- as well as special MDX commands such as CURRENTMEMBER, PREVMEMBER, LEAD and LAG
The OLAP processor returns the figures; the MDX processor makes the calculation.
The following code fragment gives an example of this: At runtime, the Calculated Member profit change from previous month (Profit Change) is calculated by subtracting the Profit for the previous month from the profit for the current month:
[0CALMONTH].PREVMEMBER) )'SELECT
The following graphic displays the results table: Both the profit and the profit change against the previous month is shown for all months of the year 2001.

Example 2
Using the MDX function AGGREGATE allows you to carry out multiple filtering at run time.
The following MDX fragment gives an example of this. At run time, the filter specified in the WHERE clause is constructed. The system aggregates along the three values in the Calculated Member AGGREGATE function.
[0D_PLANT].[6666] } )'SELECTON ROWSFROM [0D_SD_C03/SAP_DEMO_ODBO]WHERE ([0D_PLANT].[Aggregate])
The following graphic shows the results table: The system returns the profit, the number of documents, and the open orders for the months in 2001 for the selected values OD_PLANT = 1111,2222,6666.

Example 3
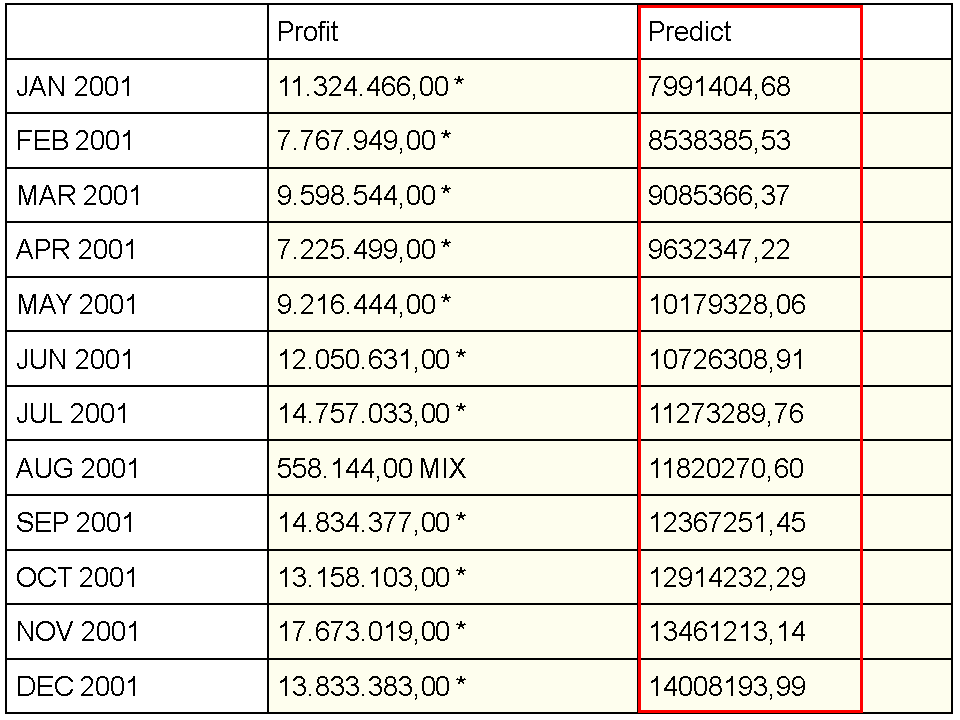
Using Calculated Member also allows you to apply linear regression, a special form of time series analysis. In linear regression, the line of best-fit is calculated from a series of dots. This function can be used to predict future values.
The following code fragment shows an appropriate example:
LinRegPoint([Measures].[CKF_SI_PROFIT],{ [Measures].[CKF_SI_PROFIT],[Measures].[Predict]}The following graphic displays the results table: The profit is displayed as is the predicted value taken from the linear regression calculation:
The following chart depicts the actual profit values per month (blue dots) against the predicted values (red dots) on the line of best-fit:
