BusinessGraphics Properties
- backgroundColor
Background color of the BusinessGraphics UI element.
- categorySource
Path to the context node in the hierarchical structure of the context that provides the data for the category.
- chartType
See also Chart Types.
Value Description area
Area chart
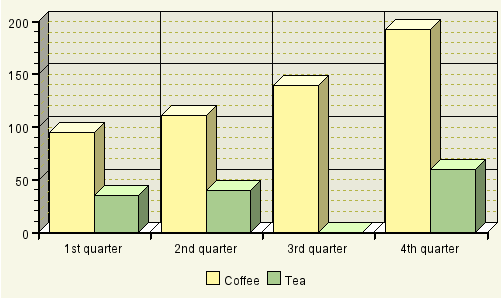
bars
Bar Chart
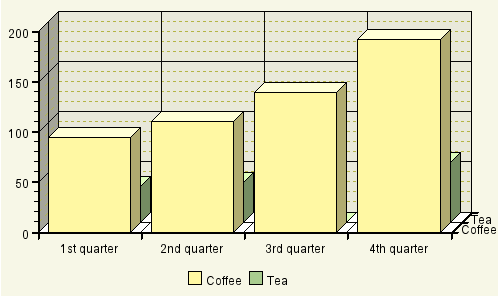
columns
Vertical bar chart
delta_chart
"Delta Chart"-type chart
doughnut
Doughnut chart
gantt
Gantt chart; see also UI Element BusinessGraphics (chartType gantt)
histogram
Histogram
lines
Line chart
mta
Milestone trend analysis chart
pie
Pie chart
pipeline
"Pipeline" chart type
polar
"Polar" chart type
portfolio
"Portfolio" chart type This chart type can be used as an analytical tool in strategic business planning, for example by displaying visually the competitiveness of the company.
profiles
"Profile" chart type
profile_area
"Profile Area" chart type
radar
"Radar" chart type
scatter
Scatter chart
smart_map
"Smart Map" chart type
speedometer
Speedometer chart
split_pie
Split pie chart
stacked_area
Stacked area chart
stacked_bars
Stacked bar chart
stacked_columns
Stacked vertical bar chart
stacked_lines
Stacked line chart
stacked_profile_area
"Stacked Profile Area" chart type
stacked_profiles
"Stacked Profiles" chart type
stacked_radar
"Stacked Radar" chart type
stacked_time_bars
"Stacked Time Bars" chart type
stacked_time_columns
"Stacked Time Columns" chart type
time_bars
"Time Bars" chart type
time_columns
Diagramm des Typs "Time Columns"
time_scatter
"Time Scatter" chart type
- customizing
How the graphic is displayed on the screen. This property is assigned a Web address (URL), which points to an XML file that describes the appearance of the business graphic on the screen (for example, color of the graphic, background color, fonts, and so on, or whether the graphic has a legend). You can also make these settings directly in the View Designer using the Chart Designer tool. To call this tool, place the cursor on the UI element, click the secondary mouse button, and select Edit Customizing in the context menu. See also, Chart Designer. The BusinessGraphics properties dimension and fontFamily are provided by the meta model itself. They overwrite the Customizing settings if they differ from meta model settings.
- dimension
Dimensions of the chart
Value Visualization Description pseudo_three
Pseudo-three-dimensional chart in which the z axis is not visualized
three
Real three-dimensional chart
two

Two-dimensional chart (area chart)
- fontFamily
Font type that the graphic elements use
- height
Height of the UI element in pixels
- igsUrl
Web address (URL) of the server on which the Internet Graphics Service is to run
- imageData
This attribute must be bound to an XSTRING. It contains the content of the graphic file that is sent to the browser. It is refilled after every roundtrip.
Note that this property is not available for invisible BusinessGraphics UI elements.
You can find a test example in the system in the component WDR_TEST_BGFX_DOWNLOAD.
- seriesSource
Path to the context node in the hierarchical structure of the context that provides the data for the series or SimpleSeries.
- transparentColor
Color to be used as the transparent color. You can specify the color in RGB, HSB, or in X11, for example rgb(255,0,0) or slateblue.
- width
Width of the UI element in pixels