How the Local Garbage Collector Works
In Java, objects are allocated in the Java heap. If there is not enough space in the heap, a garbage collection (GC) is started. The garbage collection releases objects that are no longer referenced. The heap is divided into two generations - young and old:
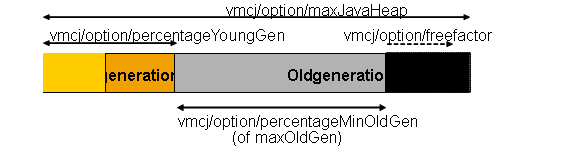
New objects are created in the young generation. Objects that have survived two garbage collections are moved ( promoted) to the old generation. The garbage collection can be carried out separately for the young and old generation areas. The statistic record in STAD (see below) contains information about the number of garbage collections in the young and old generations ( GC count local young and old) as well as the time used ( GC CPU/elapsed time local young/old). It is possible that an explicit garbage collection was started by System.gc() (visible under Explicit GC count local).
The amount of allocated memory in the young generation is accumulated in Java Heap allocated local.
Memory freed up in one of the generations in the local memory is added by a GC to the Java Heap freed local young/old. Furthermore, the maximum fill level in the young and old generations is stored according to the respective GC in Java Heap max alloc local young/old. The maximum fill level in the shared memory is saved in Java Heap max alloc shared.
Shared Pool
Java objects can be allocated as Shared Closures within a shared memory area. Shared closures are created in the memory area called shared data in the shared pool (see
Memory Management in the VM Container).
If a shared closure is created, the value Java Heap allocated shared is increased accordingly. Shared closures that are old, no longer referenced, or flagged for deletion are removed by the shared garbage collection (see Functions of the Shared Garbage Collector).
The shared memory can be cleaned up manually in transaction SM53 (see VMC System Administration) ( Explicit GC count shared).
Java Memory Management: Overview in the System
You can find an overview of Java memory management in the workload monitor (transaction STAD):