Using Logs
Top Level Information
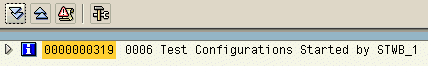
The first line of the log displays the log identification number and the transaction from which the tests were started. It also states whether a user interaction has taken place or not. Depending on the tests, other information is also displayed:
-
The number of test configurations started
-
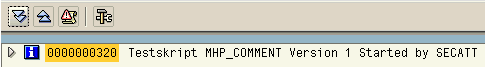
The name of the test script or test configuration
-
The version number of the test script
The following example shows that six test configurations were started from the Test Organizer.
The next example shows that test script MHP_COMMENT was started from eCATT.
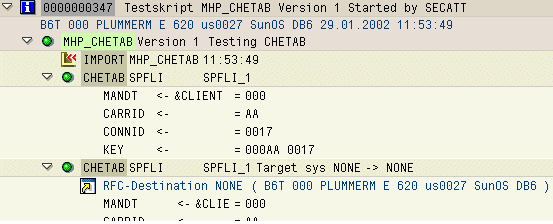
The following information about the start system is displayed directly below the information icon:
-
System
-
Client
-
User
-
Language
-
Release
-
Application server
-
Operating system
-
Database system
-
Date
-
Time

Maintenance System
If a test script has a maintenance system, the RFC destination is displayed beside
 , and the component information is underneath.

RFC Destinations
An RFC destination, for a target system assigned to a command, is displayed beside
.
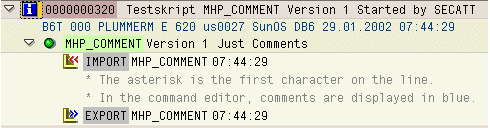
Comments
You can display the comments from the test scripts in the log. Choose
 and then choose
Display Comments in the next dialog box.
and then choose
Display Comments in the next dialog box.
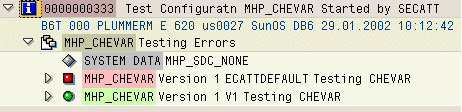
Error
An error is marked by
 .
.
If a script contains one or more errors, it is marked by
.
If a node is marked as containing an error, the node above it in the hierarchy is marked as containing an error.
The following log shows a test configuration containing two variants. One has at least one error and the other has no errors.
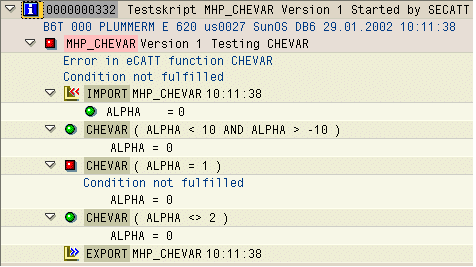
IF...ENDIF Structures
If a condition is true, it is marked by
 .
.
If a condition is not met, it is marked by
 .
.

A condition that is not met is not an error.
Viewing XML Data
XML data is generated when testing function modules, transactions, or using any eCATT command that has a command interface. To view XML data, click the name of the XML data in the log.

Here is an extract of XML-DATA-01 from the log shown above:

Messages
All the messages that are output (for example, those from a transaction) are displayed in the log. They are also displayed in the XML data.

You can display the long text of a message by clicking the message in the log.
Navigating to eCATT Objects
If you click on an eCATT object in the log, you can display it in the respective editor. For example, if you click on the colored area in the log below, you can call the configuration editor, the system data editor, or the test script editor.

Navigating to the Spool Display
A message is written in the log when a recorded transaction uses a print function that sends a document to the spool administration. By choosing the message, you can call the display of the spool request. To enable this, you need to maintain the Customizing table ECLOG_SPOC with the message ID, message number, and which variable part of the message contains the spool request number.

In the above example, you would have created an entry in the table with SY, 374, and 1.
Setting the Time Display
The time data in the log for test configurations, test scripts and executed commands is displayed in a uniform format. You can use this setting to define whether the duration, the time of execution, or a combination of the two values is displayed. You can also completely blend out the times.
If you change the settings, this has an immediate effect on the current log display.
-
Choose
 Utilities
  Settings
  .
. -
Choose one of the following settings in the field Time Data:
Option
Description
D Duration
For test configurations, test scripts and block commands such as REF, MESSAGE, IF, DO, LOOP, etc the duration always refers to the execution of the entire subordinate block of eCATT commands.
The duration is always displayed in seconds with three decimal places. Hours and minutes are displayed in front with a colon (:) for longer durations.
Example: [4:32,789]
For SUT commands with execution in a "System Under Test", such as FUN, ABAP, ESF, SAPGUI or WEBSERVICE, the system also displays the SUT time, the time required internally by each application.
Example: [3,45 / SUT: 2,78]
Z Time
The start time of each command, the test configuration or the test script variant is displayed as a time in the form [ Hour Minute Second] according to the user setting.
Example: [09:17:08]
X Duration and Time
The start time and the duration are displayed as a combination of the specifications above.
Example: [09:17:08 / 4:32,789]
[SPACE] Display Deactivated
For test configurations, test scripts, and for executed commands, neither time nor duration are displayed in the log.
-
In order to set up for which commands the setting for the time specifications is active, choose one of the following options in the field Range of Time Specifications;
Option
Description
[SPACE] - Only for block and SUT commands
The set time data (time and/or duration) is given for the following entries:
-
Test configurations
-
Test scripts
-
Block commands (for example, REF, MESSAGE, IF, DO, LOOP)
-
SUT commands (for example, FUN, ABAP, ESF, SAPGUI, WEBSERVICE)
X - For all commands
The display of the start time or duration can also be enhanced on all commands.
-