Measuring the Runtime of Availability Monitoring with the GRMG
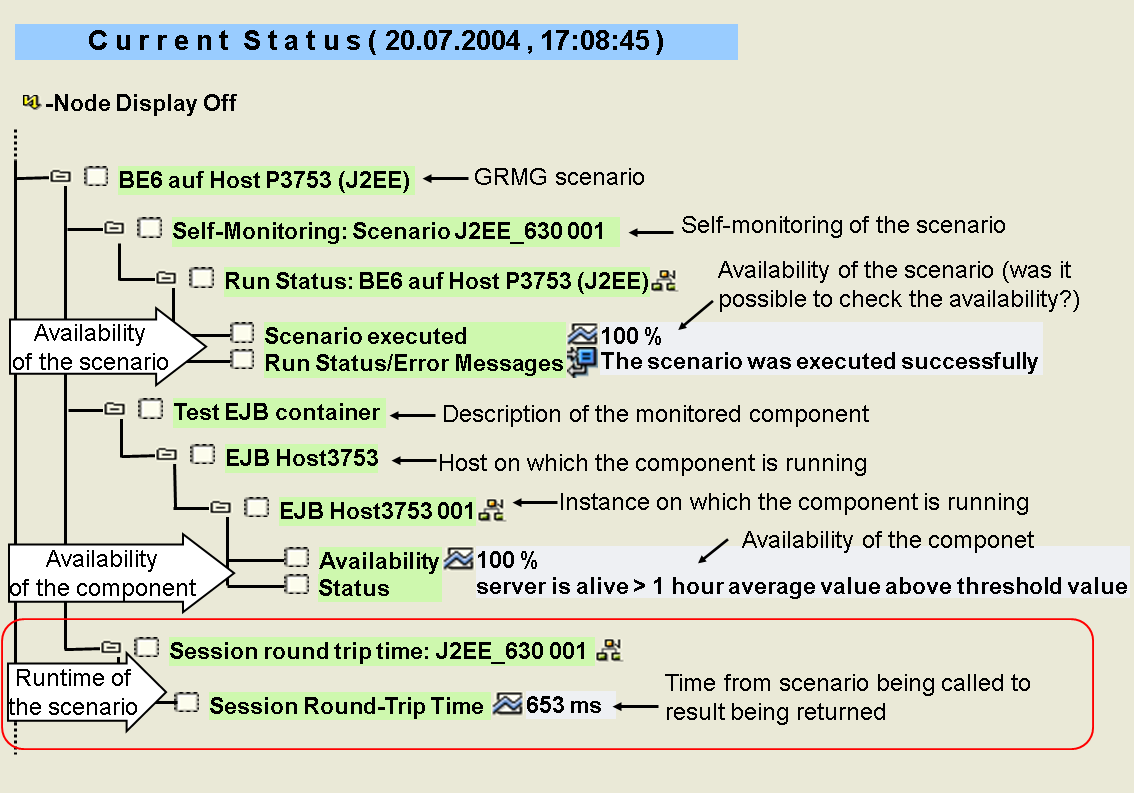
You can measure the duration from calling the GRMG application to the return of the result for each scenario, and display the results in the Alert Monitor. A third subtree containing the measured duration is then displayed in the Alert Monitor for the corresponding scenario, in addition to the actual availability and the self-monitoring of the scenario.
The time measurement is measured in the GRMG infrastructure in the central monitoring system. The time therefore includes the network time of the request in addition to the processing time in the GRMG application (or in the case of GRMG Lite scenarios in the Web server).
To activate runtime measurement for a GRMG scenario, proceed as follows:
- Start transaction GRMG. The Generic Request and Message Generator screen appears.
- Select the desired scenario and choose
 Edit GRMG Customizing.
 - The Edit GRMG Customizing screen appears. If you want to perform the runtime measurement for a GRMG Lite scenario, execute the following commands:
- In the Editable Properties table, set the Property Value to X for the Property Name GET_RUN_TIME.
- Save your entries and exit the screen by choosing
 Exit.
Exit.
- If you want to perform the runtime measurement for a normal GRMG scenario, execute the following commands:
- Create a new component by choosing
 Append Line.
 - Enter the following data in the new line:
Component: GRMG_RT
Property Name: GET_RUN_TIME
Property Value: X
Leave the other fields empty.
- Save your entries, confirm that you have entered a new component, and enter any description text on the Component Descriptionscreen (it is not displayed in the Alert Monitor).
- Confirm the next message, and exit the screen by choosing
 Exit.
Exit.
- Create a new component by choosing
After performing the configuration steps, an additional subtree is displayed in the Alert Monitor for the corresponding GRMG scenarios that contains the processing time of the scenario:
 Monitoring with the Generic Request and Message Generator start page