Memory Analysis
You can perform a memory analysis for your Web Dynpro ABAP application to analyze the current memory consumption. The procedure is as follows:
-
Create a trace variant.
-
Create a memory consumption snapshot.
-
Call the memory inspector
-
Analyze the data.
Create a trace variant.
-
Start the new debugger for the Web Dynpro application you want to analyze.
-
In the toolbar of the new debugger choose the icon Replace Tool .
-
Under Special Tools select the entry Memory Analysis and choose Continue .
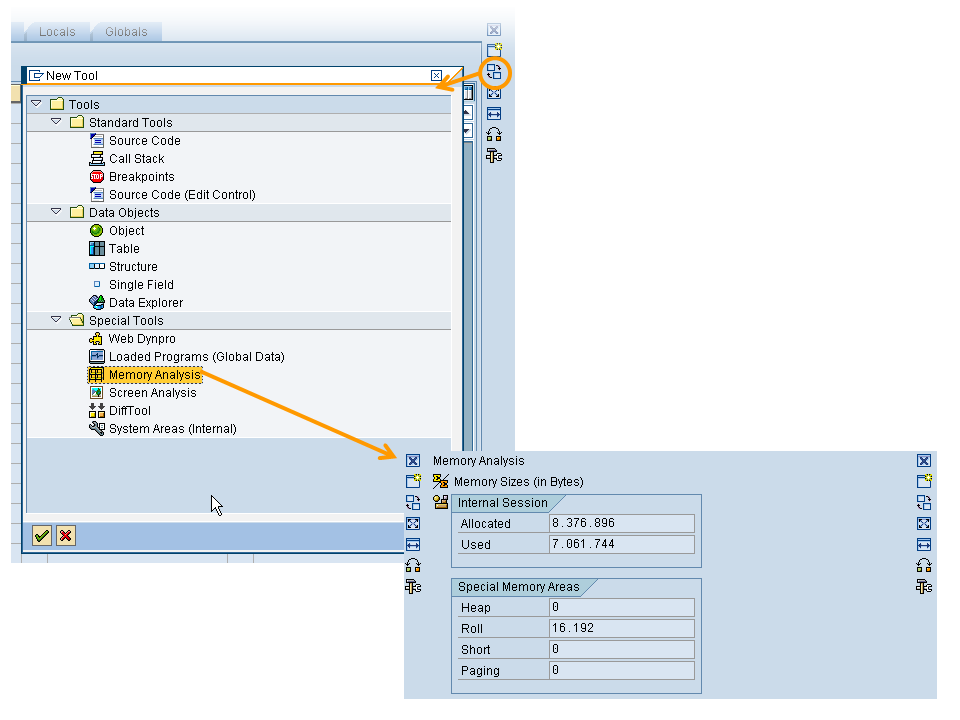
Create a memory snapshot.
-
In Tool Services under heading Tool-Specific choose entry Create Memory Snapshot .
-
Choose Continue .

You see the message that your memory snapshot has been created.
Call the memory inspector
Call transaction S_MEMORY_INSPECTOR . The results are displayed.
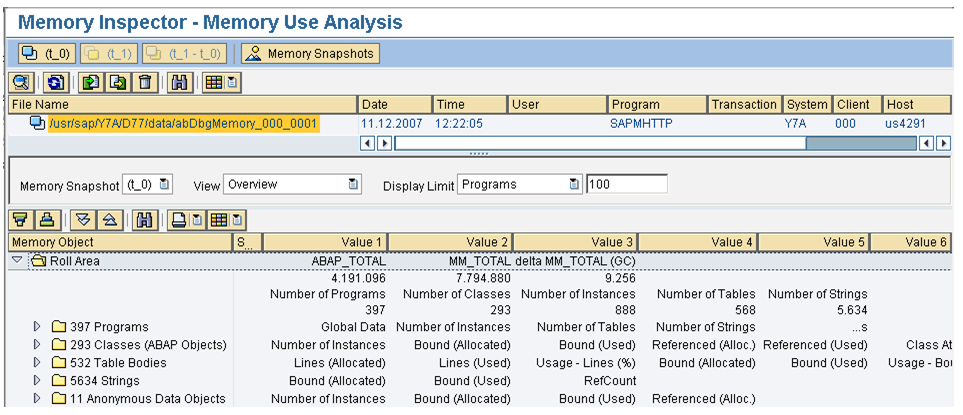
Analyze the data.
Analyze the displayed data in the memory inspector.