Example: Calculation of Consumption
Data
Example: Calculation of Consumption
Data
To calculate the average values of a
vehicle, at least two measurement documents must have been entered within a
period, so that the system can run a calculation. If necessary, it might be
advisable to create an initial document. For more information, see
 Fleet
Management.
Fleet
Management.
Measurement Documents
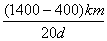
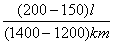
The following measurement documents are created for a vehicle:
|
Date |
Measurement documents for the primary counter |
Measurement documents for the fuel counter |
|
01. January |
400 km |
50 l |
|
06. January |
800 km |
100 l |
|
16. January |
1,200 km |
150 l |
|
21. January |
1,400 km |
200 l |
Periods
Long periods: Difference of the days: 21 January – 01 January = 20 days (20d)
Short periods: Difference of the days: 21 January – 16 January = 5 days (5d)
Calculation Example
|
Calculation type |
Display |
Long periods |
Short periods |
|
Daily performance |
Long: 50 km Short: 40 km |
=
50 |
|
|
Daily consumption |
Long: 7.5 km Short: 10 km |
= 7,5
|
=
|
|
Average consumption |
15 l/100km |
= = 15 |
= = |