
 User Interface of the XSLT
Debugger
User Interface of the XSLT
Debugger

Main Screen
The user interface of the XSLT debugger consists of the following sections:
Application Toolbar
The debugger’s application toolbar allows quick access to different functions for controlling the debugging processes. For a detailed description of the individual functions, see Ways of Debugging.
Debugger Views
You can examine the status of the current XML transformation from various viewpoints. For that purpose, use the different views of the XSLT Debugger:
● Result View (switched on by default)
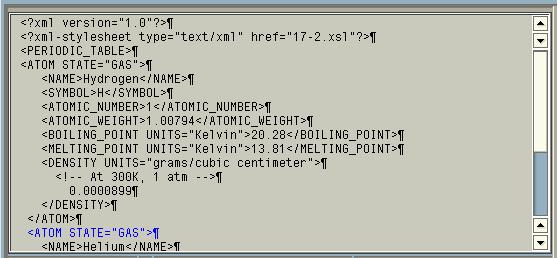
XML Source Code Display
The display of the XML source code in the debugger has the following features:
● If the XML document has the special character indicating line breaks, they are displayed in the debugger, otherwise the system inserts an automatic line break (maximum after the 255th character on the line). The code page used determines the way the end of the line is displayed:
Code Page |
End of Line Indicator |
Standard code pages (Unicode, Latin-1, EBCDIC Latin-1) |
¶ (paragraph indicator) |
Latin-2 |
¤ (currency character) |
All other code pages |
# (hash sign) |

The motivation behind this way of handling line breaks is the need to display XML source code as close to the original as possible. Blanks and line breaks are an important part of the XML source code.
● The currently processed XML node is highlighted.

XSLT Program Display
The source code of the XSLT program is displayed as close to the original as possible. The display has the following features:
● Highlighting of the currently executed line
● Highlighting of all lines with breakpoints.
