 Memory Analysis
You can perform a memory analysis for your Web Dynpro ABAP application to analyze the current memory consumption. The procedure is as follows:
Create a trace variant.
Create a memory consumption snapshot.
Call the memory inspector
Analyze the data.
Create a trace variant.
Start the new debugger for the Web Dynpro application you want to analyze.
In the toolbar of the new debugger choose the icon Replace Tool.
Under Special Tools select the entry Memory Analysis and choose Continue.

Create a memory snapshot.
In Tool Services under heading Tool-Specific choose entry Create Memory Snapshot.
Choose Continue.

You see the message that your memory snapshot has been created.
Call the memory inspector
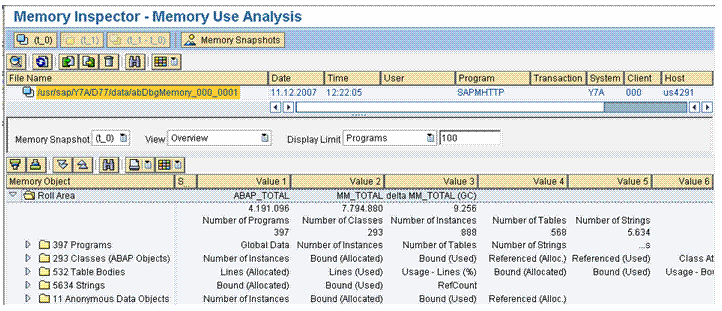
Call transaction S_MEMORY_INSPECTOR. The results are displayed.

Example
Analyze the data.
Analyze the displayed data in the Memory Inspector.