 XSLT Debugger and ABAP Debugger

Switching from the ABAP Debugger to the XSLT Debugger
It is possible to start the XSLT Debugger either from the execution mode of the ABAP program, or from the ABAP Debugger. You can open the XSLT Debugger only if you have set breakpoints in the XSLT program. For more information, see Starting and Exiting a Debugging Session.
Switching from the XSLT Debugger to the ABAP Debugger
The situation is
the same when you wish to switch from the XSLT Debugger to the ABAP Debugger.
ABAP statements in an XSLT program (for example, CALL-EXTERNAL or EXTERNAL-FUNCTION) make the system switch to the ABAP Debugger
only if you have set a breakpoint in the called method or function module. For
more information, see
 Starting the ABAP
Debugger.
Case Example
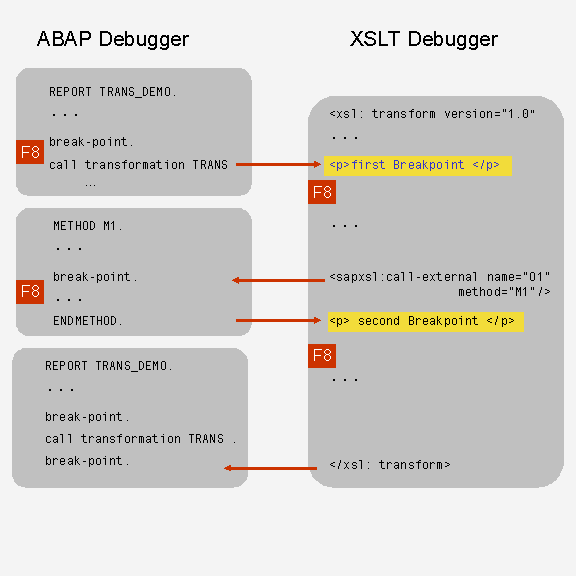
The following scenario demonstrates the flow of a typical debugging session based on the interaction between the ABAP Debugger and the XSLT Debugger.

You start an ABAP program in debugging mode. The program is executed up to the point where the transformation is called. Since the called XSLT program (in our case: TRANS) contains breakpoints, the XSLT Debugger starts and the execution of the transformation stops at the first breakpoint.
If you continue processing the XSL source code until you reach an ABAP method call (call-external) , the system switches to the ABAP Debugger (if the method that is called (in our case: M1) contains a breakpoint).
At this point, you can continue to execute the program by pressing F8. Then you return again to the XSLT Debugger. The line after the external method call is now the current line in the XSLT program. After the end of the transformation, you return to the ABAP Debugger. The current line is now the line after the calling point in the transformation.

