Selection Options - Global Display of the Coverage Analyzer
Views
When you choose Other View at the top of the screen, you can select either the Author or Package view.
History
When you choose Different History at the top of the Global View screen, a dialog box appears containing all the available recording versions of the Coverage Analyzer. When you choose Different History at the top of the Global View screen, a dialog box appears containing all the available recording versions of the Coverage Analyzer. The curve for this version is then displayed on the right of the screen.
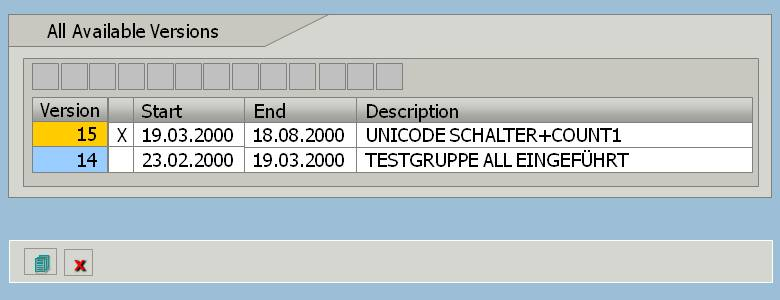
A history contains all of the data and results recorded over a particular period of time. To create a new history, you have to switch the Coverage Analyzer off and then on again in the On/Off Status menu. This is recommended if the same changes have been made to all programs at the same time, for example, switching on the Unicode check. Other possible reasons include a release upgrade or a change in the coverage valuation.
Nodes
The Package view contains a tree structure in which test groups, persons responsible and packages are displayed as nodes. The node ALL is always displayed. The node COND is only displayed if data is summarized across several systems. You can expand and collapse the node levels in the usual way.

The screen above shows the node ALL together with its subnodes and selected attributes. You select the displayed attributes by choosing
Settings
 Detail. You can show and hide additional information by choosing
Detailed Node Information. You can change the widths of the columns of the individual attributes by placing the cursor at the edge of the column headers and dragging these to the left or right keeping the left mouse button pressed.
Detail. You can show and hide additional information by choosing
Detailed Node Information. You can change the widths of the columns of the individual attributes by placing the cursor at the edge of the column headers and dragging these to the left or right keeping the left mouse button pressed.
View and Attribute Settings
When you choose Settings in the node area, a dialog box appears in which the Detail tab page contains a selection of attributes that can be displayed. You can select the following attributes (multiple selections are possible):
-
Percentage of program units executed
-
Percentage of program units containing a runtime error
-
Percentage of program units reset
-
Percentage of program units that have been executed since the last reset
-
Percentage of program units that have had a runtime error since the last reset
-
Percentage of program units with an activated Unicode switch
-
Capacity utilization
-
Percentage of program units tested
-
Number of processing blocks
You can also specify whether you want to display information on the original system, transport layer and a more detailed description of the node.
You can make further settings that affect the users concerned on the Local View Setting tab page. On the Global View Setting tab page, you can enter specific systems, transport layers, counters, traffic light colors and date ranges.