Two-Process Architecture in the ABAP Debugger
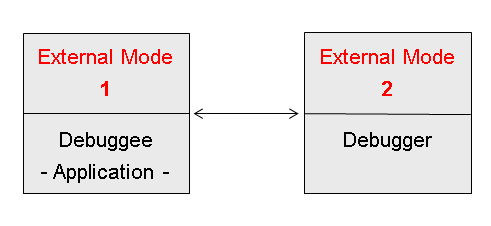
The Classic ABAP Debugger (no longer recommended) runs on the same internal mode (role area) of the same main mode (external mode) as the application that is to be analyzed, whereby the Standard ABAP Debugger uses an additional main mode and is displayed in a separate SAPGUI window (two-process architecture). The application to be tested (the debugee) is controlled by the ABAP Debugger.
The use of a common session has certain handling advantages as well as advantages with regard to resource consumption. However, the disadvantages that arise through this narrow link between the application and the Debugger clearly outweigh any advantages:
There are certain interactions between the application and the Debugger that enable only very limited options for the layout of the user interface in the Classic Debugger. The user interface of the Standard ABAP Debugger, on the other hand, can be configured as required so that the user can design the user interface to suit his or her requirements.
Program units called directly from the ABAP kernel cannot be analyzed with the Classic ABAP Debugger. Such calls, for example, take place at each conversion exit.
The Classic ABAP Debugger analyzes a roll area that, when canceled, itself cancels the Debugger. Therefore, all the existing settings, such as the display of variables in the Classic Debugger, disappear as soon as the limits of the roll area are exceeded – for example, whenever the statements SUBMIT or CALL TRANSACTION are called. On the other hand, the Standard ABAP Debugger analyzes an external session. As long as this external session is active, the Debugger will remain open and control this session.
For this reason, the user will switch - during a Debugger session - from the Debugger to the application window if the application requires a user action. Here, of course, the Debugger window is not ready for input in this state. If input on pages of the application is complete and the program is still running, the Debugger window is ready for input again as soon as the next interruption is reached. If the input focus changes from the Debugger to the application and vice versa, the window that is ready for input is automatically placed in the foreground by the Graphical User Interface (GUI).
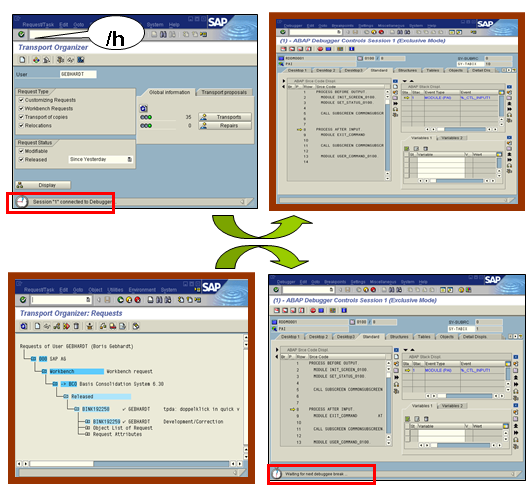
In the following graphic, the Debugger is started by entering /h. It remains active until control passes back to the application as a consequence of a user action. The Debugger receives control again when a breakpoint is reached or when the application explicitly activates the Debugger using /h. The application session is then subject to the control of the Debugger mode until the application session is closed or until Debugger mode is cancelled explicitly using /hx.
This behavior is especially useful when analyzing roll area-independent programs in debug mode. While a new roll area is opened, the same instance of the Debugger remains open and all settings, such as the arrangement of tools or list of displayed variables, remain unchanged.
This behavior could be detrimental if you do not wish to close the Debugger explicitly, but instead want the Debugger to be closed automatically at the end of a roll area, such as after choosing F8 (Continue) as a Debugger command (this is how the Classic Debugger behaves). You can define this behavior in the Standard ABAP Debugger using the main menu:  Settings
  Debugger Settings Continue to F8 and Roll Area End
  .
.