Trend Analysis and Reporting with the Global Display
You can conveniently analyze trends in code coverage in the Global Display itself.
However, the Global Display offers little support for reporting, and many Quality Assurance experts also prefer to use the more flexible trend analysis capabilities of external spreadsheet programs rather than the Global Display.
This section therefore reviews both of the following:
-
trend analysis in the Global Display, and
-
how to export data for use in external programs.
Trend Analysis in the Global Display
Use the tabular and graphical displays in the Global Display in tandem to get a quick overview of the trend in code coverage.
In this example, the user has selected the history record for package ABAP_TEST. The table layout includes the current statistics and cumulative statistics for processing block coverage and branch coverage.
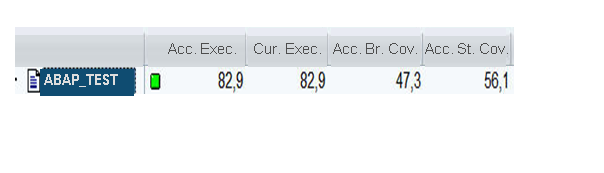
In the tabular view, the first two columns of the table show a processing block coverage of over 80 percent for both the current measure and the accumulated measure.
The third column shows a cumulative branch coverage of almost 50%.
The fourth column shows that code coverage at the level of individual statements is almost 60%.
The tabular view shows the newest code coverage information in the history that you are displaying.
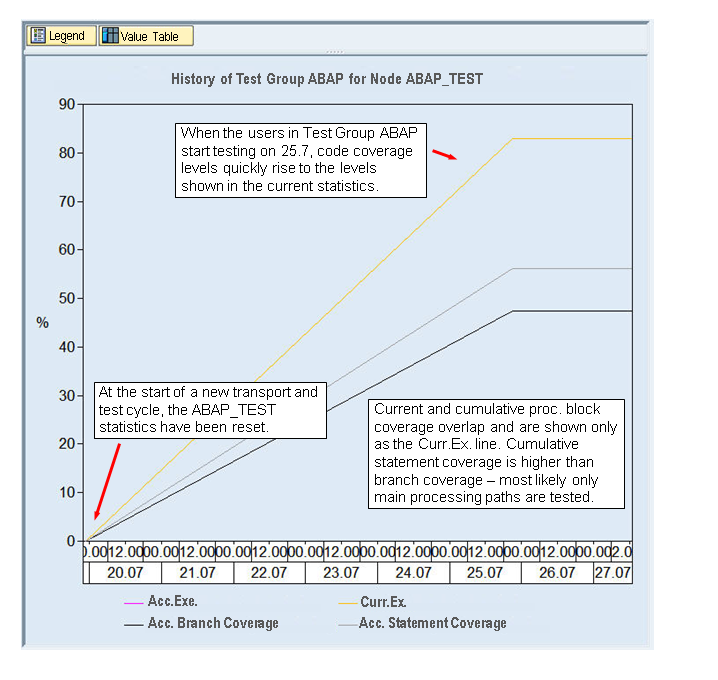
The graphical view shows that this history contains data from a single week and a single test cycle.
The week starts off with a complete reset of the Coverage Analyzer statistics for package ABAP_TEST. The history starts fresh with a code coverage of zero percent.
When testing starts on the 25th of July, the code coverage levels quickly rise to the levels shown in the table. The jump in the statistics to stable final levels suggests that efficient automated testing is in use, for example, with the Code Inspector and eCATT.
You can compare the code coverage in package ABAP_TEST across test cycles either by:
-
Letting the history version run across more than one week and one test cycle. The lines in the graph would then show the high-water marks in the test cycles recorded in the history. If there is a reset between test cycles, then the graph will clearly show the borders between cycles.
In the illustration above, the history so far records only one test cycle during one week.
-
Switching to the previous history in the Global Display to see the results from an earlier test cycle or set of test cycles.
Exporting Code Coverage Data for Use in External Programs
To reuse data from the Global Display in external programs, such as spreadsheets, click on the Value Table button on the Global Display.
The Coverage Analyzer displays the history data records that are shown in the Global Display graph.
Mark the records that you wish to use and choose the Export function to download the records.
Global Display data records aggregate code coverage to the level of the development package. If you need data for individual programs, then you can export data from the Detail Display.
To reuse data from the Detail Display, display the programs for which you wish to export data. Then choose the Export function. All of the data records in the Detail Display are exported.