Sorting: Example 2
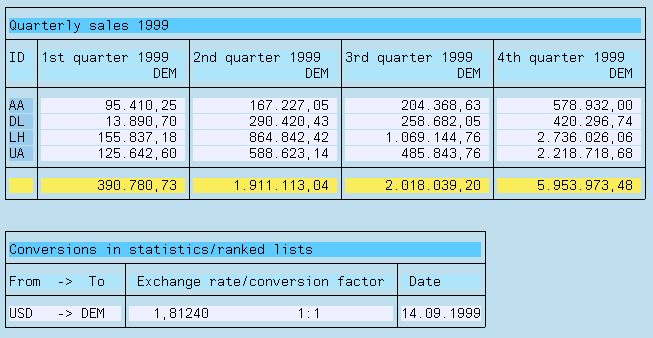
The following example demonstrates how you can use local fields with calculations which depend on conditions in a sorted statistic. The statistic contains quarterly sales figures of individual airline carriers for a year which you specify on the selection screen.
Prerequisites
You have defined the query S1 as described in Compiling Statistics.
You are in the Statistics screen sequence.
Procedure
On the Field Selection screen, define the local fields as shown in the following illustration (see also Assigning Short Descriptions and

The field Year is a local field which you specify on the selection screen. Its value determines the year for which quarterly sales figures are required.
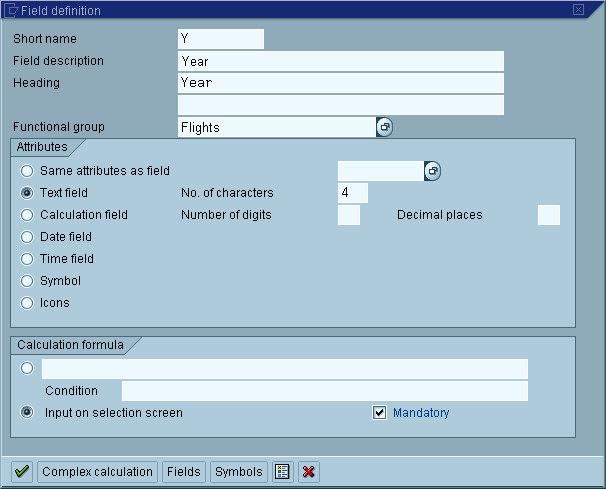
There are two things to take into account with the fields for quarterly sales figures. The InfoSet retrieves per flight (flight date) the total existing bookings. Using the flight date, you can thus determine to which quarter this total is to be assigned. Furthermore, only the quarters of a pregiven year should be determined according to the task. A quarterly sales figure is, therefore, the same as the booking total if the flight data lies in the pregiven year and in the correct quarter. As an example, we can use the definition of the field for bookings in the 2nd quarter.

Note that this example uses a replacement variable (&Y) in the column header.
Once you have defined all local fields, change to the Statistics screen sequence by clicking on the Statistics pushbutton.
Choose Next Statistic to define a new statistic.
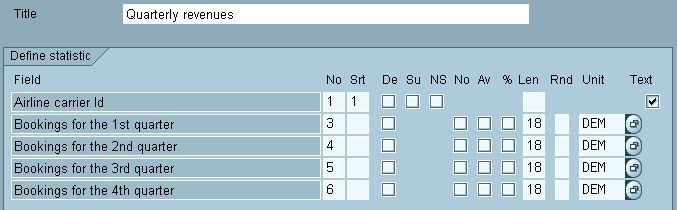
Define the statistic as shown in the following illustration:
Use the Test
 function to test the query.
Result
The following list is displayed: