
 BI UD
Connect: Performance Issues
BI UD
Connect: Performance Issues

Problem Description
The performance of a data extraction using BI Universal Data Connect (UDC) is slower than the expected benchmark data (provided later in this document).
From an architectural perspective, this case involves three distinct layers: the DB layer with a relational database (RDBMS) from which the data is selected (although UD Connect also supports OLAP sources), the J2EE Engine on which the connectors and the UDC components run, and the BW server on which the extraction function modules reside. The overall architecture is pictured in the following figure:
Potential problem areas:
...
1. Processing of data in the BW ABAP back end
2. Bandwidth of the RFC connection between ABAP to Java
3. Processing of data in UDC
4. Selection of data on the DB layer
5. Bandwidth of the connection between the DB and the Web Application Server if these are on different systems
|
Scenario Type: |
Performance analysis |
|
NetWeaver Component: |
SAP Business Information Warehouse (BW) |
Decision Roadmap
For interpreting the performance figures in UD Connect scenarios, not only do you need to understand how much time is spent processing the data on the different layers of the architecture and transferring data between them, you also need to know how much data is processed.
For example, the extraction might take a long time, but the reason could be that the customer is running a very unrestricted query that simply returns a huge amount of data. Performance data needs to be normalized to a relative number, such as throughput per hour, to make it comparable against performance on a standard test system (benchmark). Such benchmark results, however, can only serve as a guideline for evaluating numbers a customer might report. In addition, the customer's particular hardware environment can have a significant impact on performance and scalability.
Prerequisites
Make sure that you have valid users to access the BW ABAP back-end system and the corresponding J2EE Engine Admin tool. You might also need authorizations to access the source database from which you are extracting the data.
Main Tools
-
Execution
Retrieving the trace Information
You can retrieve detailed information about UD Connect performance from the log file. The SAP Web AS writes the all the trace to one central log file, which is the J2EE Engine’s log file (defaultTrace.trc). You can override this setting to write the trace to the application-specific log file.
The setting in the SAP Web AS server’s Kernel/LogManager/ForceSingleTraceFile is YES by default which enforces all the traces to be in one central J2EE Engine log file (defaultTrace.trc).
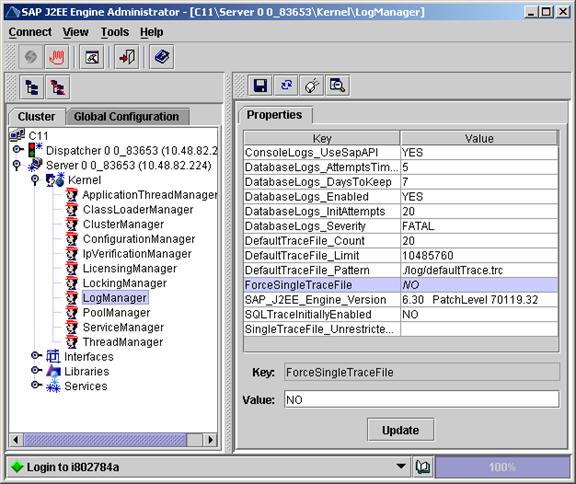
However, if an application-specific log file is desired, change this setting to NO. Perform the following steps to set log severity and retrieve trace information in the J2EE Engine’s Log Configurator:
1. Open the Visual Administrator of the J2EE Engine.
2. Expand the Server node ® Sevices ® Log Configurator.
3. Select To advanced mode to see the Locations entries.
4. Expand the Root node to point to com/sap/ip/bi/sdk.
5. Change the default severity from WARNING to DEBUG runtime.
6. Use the Locations tab to log trace information and the Categories tab to log logging information.

Two log files are created in the file system under the path: <SAPJ2EE Engine folder>\ cluster\server\log\applications\UDI.log and UDI_default.trc.
7. View the UDI_default.trc file via the LogViewerservice in the VA. This file provides the trace information.
The UDC component has the necessary instrumentation in the code to provide the information needed for analyzing the problem areas as explained later in this document. The trace information is retrieved from the J2EE Engine’s log file or the application log file. Once all the data packets are returned, UDC writes a trace that looks like the example below at the end of the UDI_default.trc file:
This table displays the information based on each data packet. The information is structured into the following columns:
Label |
Description |
Pck # |
Packet number |
Time- UDC (ms) |
Time spent in UDC processing in milliseconds |
Time-ABAP (ms) |
Time spent in the ABAP process between the packet calls in milliseconds |
Time-Query (ms) |
Time spent in the query execution/data selection in milliseconds. The query execution happens only in the first call. The rest of the calls does not go through this process. |
Data volume(bytes) |
Data volume returned by the call |
Rows |
Number of rows returned by that call |
● Total for Time-ABAP (ms):
Time spent by ABAP processing. This time is a part of the total time used by the complete UDC staging or data loading scenario. This time is influenced by the processing speed of the ABAP function modules, RFC Engine, and BW server speed.

Note that the total for the Time-ABAP will be little bit higher than the output. This is due to fact that after the last call the UDC returns the control to the ABAP side, and before doing that it writes out the performance trace. However, the time taken by the ABAP side after getting the control from the UDC in the last call will not be a great deal. We are currently discussing if we can provide exact numbers in the performance trace including any time spent by the ABAP after the last call to the UDC.
● Total for Time- UDC (ms):
This the other part of the total time used by the UDC staging or data loading scenario. This time refers to the time spent in the UDC components that are running on the SAP Web AS. This time can be influenced by the factors listed below:
○ The processing time of the BI Java SDK components and connectors
○ The native drivers and libraries used to process UDC requests
○ The processing load of the SAP Web AS
○ The network speed
○ The data volume requested
● Total for Rows:
This number represents the total number of data records returned by the whole process.
● Total for Time-Query (ms):
This number represents the time taken to execute a specific query by the BI Java SDK connector. Although the query execution is handled by the connector, this number is influenced by other external factors such as the following:
○ The efficiency of the database on which the query is executed
○ The network speed
○ The processing speed of the underlying native resources used to connect and execute the query
Analysis
To analyze a UD Connect performance issue, follow the steps below:
● Step 1:
Inspect the Total time and Total Data volume and calculate the throughput. This step is useful for evaluating whether there is an issue at all or if the application performs as suggested by the benchmark numbers. In table 1 below, we have listed data for a benchmark data. If the throughput in the customer scenario is similar to the benchmark data, the application is performing up to the mark. If the throughput (data volume/ hour) is much slower, continue with the steps below.
● Step 2:
Enter the performance data retrieved from the above trace for the customer scenario into table 1 below in the Analysis Scenario column. The benchmark column contains the data for the various processing steps for the benchmark scenario. Next, compare the numbers of the analysis scenario against the benchmark data. Depending on the layer from which the problem originates, one of the processing steps (Total time for Time-Query, Time- UDC, Time- ABAP) may show significantly higher numbers compared with the benchmark. Continue the analysis in each of these cases with the steps below.
○ Case A: Slow Database select
A pattern of data for this case is shown in table 1 in Case A. Since the connected database in a UD Connect scenario is not governed by any of the SAP NetWeaver tools, specific knowledge is required about the database and its tools for analyzing query performance. In some cases (such as when using JDBC drivers for proprietary file formats), it may not be necessary to analyze the query execution process. Retrieve the SQL select statement issued by the UD Connect application component application’s trace file/J2EE Engine trace file (see above explanation for retrieving the trace Information)
Debug: getColumn(Table) query statement::SELECT "Orders"."OrderID" AS "OrderID" FROM "Northwind"."dbo"."Orders" "Orders"
It is possible that this case occurs with a slow network connection to the database from which data is extracted.
○ Case B: Slow UD Connect processing
This might happen when other processes create load on the hardware and the J2EE Engine on which the UD Connect application component is running. Check with the J2EE Engine administrator to verify what other processes are running on it and, if possible, reduce the load to make the UDC perform faster. This case can also happen because of a slow network speed or the amount of data requested is too high.
○ Case C: Slow ABAP processing
The ABAP processing time is measured by the UD Connect component as the aggregated time between subsequent calls to the UD Connect component. This time includes the time spent for the RFC which cannot be distinguished from the actual processing time. A slow RFC might be one reason for this. To determine the cause for the delay, run transaction sm59 to check the speed of the RFC connection between the BW server and the J2EE Engine.
Other scenarios: Additional scenarios are conceivable in which multiple factors contribute to performance issues. Analyze each individual factor as described in these steps.
Table 1:
This table displays processing times in different layers of the architecture for a benchmark scenario and for the three cases noted above. For simplicity, the data volume is the same in all cases. Benchmark data was measured under the following conditions: Windows 2000 SP3 server, with four Intel Pentium III Xenon processors running at 700 MHz and 3,8 GB RAM. The size of each record was 1kB.
Table 1
|
Benchmark |
Case A |
Case B |
Case C |
Time-ABAP |
40 min |
40 min |
40 min |
100 min |
Time-UDC |
15 min |
15 min |
75 min |
15 min |
Time-Query |
5 min |
65 min |
5min |
5 min |
Time-Total |
60 min |
120 min |
120 min |
120 min |
Total data rows aggregated |
1.6 mio recs |
1.6 mio recs |
1.6 mio recs |
1.6 mio recs |
Throughput |
1.6 mio recs/hr |
0.8 mio recs/hr |
0.8 mio recs/hr |
0.8 mio recs/hr |
The flowchart below shows the cases above and the options approaches to be taken accordingly.
JARM tracing:
There is another alternative to the above mentioned trace file. The J2EE Engine provides the JARM service via the application tracing service in the Visual Administrator that can be used to view the application monitoring data.
It gives a detailed view for each request, component, user and thread view. The UDC is represented by the BI:SDK:UDCONNECT label. Any information related to the BI: SDK:UDCONNECT label is about the UDC.
In the Request Overview you can select the BI:SDK:UDCONNECT request and see the data for the request in details in the tab below as shown:

In the Component Overview you can view the data of how each component is processed, the average gross time taken, outbound data, average net time, call numbers, start time and so on.

The User overview also provides the information related to the user. In the UDC, the default user is always SDK.
For more information about JARM, see
 JARM Runtime
Views.
JARM Runtime
Views.
Additional Information
-