
 Workload Statistics
You can view the workload statistics on the Workload page by selecting Workforce Management → Forecasting → Workload from within the Interaction Center Manager’s portal. The workload statistics represent the number of hours needed for various workload types for the day and week based on the organization unit you are viewing:
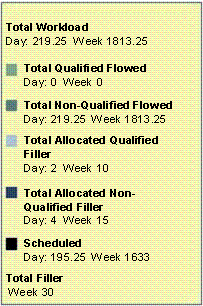
The statistics box lists the following totals for the day and week:
|
Type |
Description |
|
Total Workload |
The number of hours of coverage needed based on the demand forecast excluding any unallocated filler. |
|
Total Qualified Flowed Workload |
The number of hours of coverage needed based on the demand forecast excluding any filler for qualified workloads. |
|
Total Non-Qualified Flowed Workload |
The number of hours of coverage needed based on the demand forecast excluding any filler for non-qualified workloads. |
|
Total Allocated Qualified Filler Workload |
The number of hours of filler work that has staffing allocated to it for qualified filler workload. |
|
Total Allocated non-qualified Filler |
The number of hours of filler work that has staffing allocated to it for non-qualified filler workload. |
|
Scheduled |
The number of hours of staff scheduled to work. You see the staffing overlaid upon the coverage when you click Show Scheduled. |
|
Total Filler |
For the week, the total number of hours for all qualified and non-qualified filler work. |

Unallocated filler might exist. To determine this, subtract the qualified and non-qualified allocated filler from the total filler. Filler workload is allocated after a schedule is calculated. Prior to calculating a weekly schedule, all filler will be unallocated. In the example above, the total filler value of 30 includes 5 hours of unallocated filler.