
 The Workload Graph

Use
The workload graph displays forecasted workload in any of the following formats:
· Total Workload
· Total Flowed Workload
· Total Allocated Filler Workload
Prerequisites
You have calculated a forecast.
Features
The workload graph area covers a 24-hour period. The default is the first day of the week. View the workload for another day during the selected week by clicking on the day you want to view.
Select one of the following workload formats to view within the area:
|
Format |
Description |
|
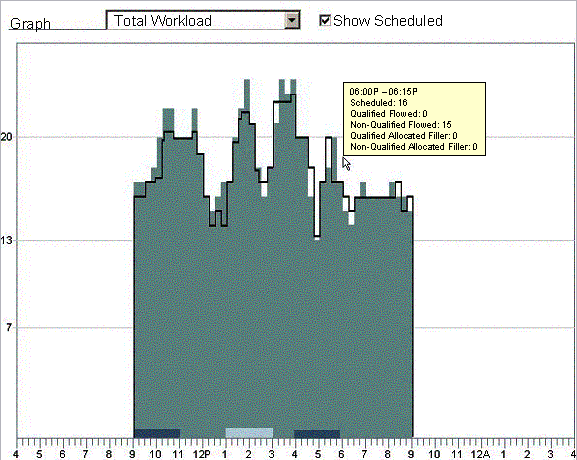
Total Workload |
A snapshot including all work, combining Flowed and Filler Workload on the same display. Note that Filler Workload is not yet allocated will not be displayed at the status box for total unallocated filler. |
|
Total Flowed Workload |
Work scheduled to coincide with activity flow or other time-dependent events. The graph should roughly match your expected volumes. |
|
Total Allocated Filler Workload |
Work assigned to a specific time after the schedule is calculated. Typically not displayed until after scheduling. See total filler hours to be allocated. |
The workload graph is organized so that the:
· Horizontal axis is in hours, set in quarter-hour increments.
· Vertical axis is in the number of people. The scale will change to reflect your staff requirements.
Organization Total Workload
The Organization Total Workload list displays:
· The color code used for all workload types shown in the graph.
· The day and weekly totals for each workload type.
Show Scheduled
As shown below, you can superimpose the week’s schedule over the calculated workload by clicking on Show Scheduled. This provides a view of how well staffed you are for the week, identifying any potential shortages as well as areas of overstaffing.
For more information, see: