Debugging ABAP Code from Within the Developer
Studio
Debugging ABAP Code from Within the Developer
Studio 
Let us assume you have a Web Dynpro application that calls function modules using Adaptive RFC, and you want to debug the corresponding ABAP code from within the Developer Studio.
You can do this quite simply, provided that the SAP GUI is installed on your local machine and the ABAP system is connected to via a dedicated server (no load balancing). You then only have to activate the relevant setting for external debugging in the ABAP Workbench and set the breakpoint in the ABAP code before starting the Web Dynpro application on the J2EE Engine.
Prerequisites
- You have debugging authorization in the ABAP Workbench in the relevant system.
- Since debugging in the ABAP system via load balancing is not supported, you must reconfigure your JCO destinations so that the calls take place on a dedicated ABAP application server. For Web Dynpro, this is done in the Web Dynpro Content Administrator. In the destination maintenance, specify Single Server Connection as the Destination Type.

Step-by-Step Procedure
- Use the SAP GUI to log on to the system or server to which the RFC call is to take place.

You should log on with the same user with which the call will take place.
Due to the large amount of parallel calls, using a collective user is not recommended.
You should try to execute the application with a dedicated user throughout the duration of the debugging session.
- Activate external debugging in the ABAP Workbench.
-
- To do this, call the ABAP Workbench using one of the transactions SE37, SE38, or SE80.
- Choose Utilities à Settings and then the ABAP Editor tab followed by Debugging.
- Enter the user for which the debugging session is to take place. Select the Active checkbox and deactivate IP-Matching.
- Save your settings.
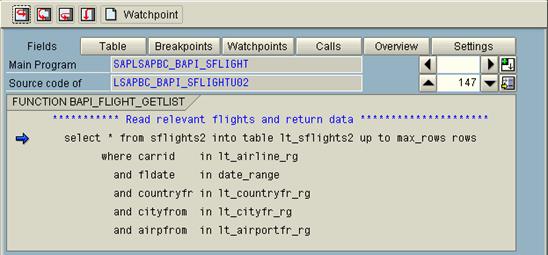
- Set an HTTP (external) breakpoint in the ABAP code.
-
- Display the source code of the relevant function module.
- Position the cursor at the place in the source code where execution is to be stopped.
-
Choose the external breakpoint icon
 from
the toolbar.
from
the toolbar.
The relevant line is highlighted.

Note that the validity period for the external breakpoint is limited to 2 hours. If you require more time to debug, you must set the breakpoint again.
- Start the J2EE Engine and – if you have not already done so – deploy your application.
- Start your test application on the J2EE Engine.
The following example of a Web Dynpro application is used to display flight data from the SAP system in a table.

The J2EE Engine establishes a connection to the SAP GUI and starts the ABAP Debugger in a new GUI session. The Debugger is stopped at the line in the ABAP code at which the breakpoint is set.