OLAP Usage According to Time
Technical name: 0BWTC_C10_Q016
Based on InfoCube: BW statistics MultiProvider (0BWTC_C10)
Use
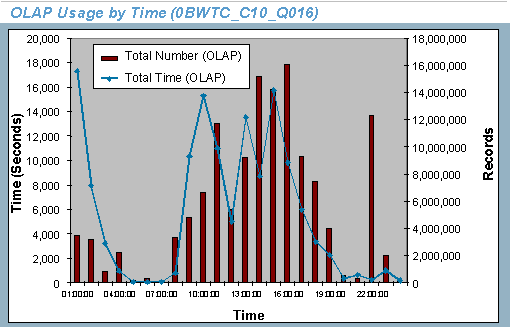
The query OLAP Usage According to Time (0BWTC_C10_Q016) subdivides the key figures contained in the Total Time and Records (OLAP) (0BWTC_C10_S005) structure according to time:
· Total Time (OLAP),meaning the total times when executing all queries
· Total Number (OLAP),meaning the records read when executing all queries
The graphic representation allows you a quick overview of whether especially high peak values occur for specific times of the day. These high peak values might possibly impair the performance of the system. The y axis on the left-hand side represents the value scale for the time in seconds; the y axis on the right-hand side represents the value scale for the number of records.
Filters
|
InfoObject |
Description of the InfoObject (Restriction or Calculation Formula) |
|
0CALDAY |
restricted to the characteristic value variable Tech.Cont.: Time Period, for which the data is selected, 0TCTDATS |
|
0TCTOLAPACT |
restricted to the following fixed values: = ODBO (5) = Print in Batch (2) = Execute Query/ Navigation Step (1) |
|
0TCTOBJVERS |
restricted to fixed value = A |
 Calendar
Day
Calendar
DayVariables Used
|
Variable |
Description |
|
0TCTDATS |
Tech.Cont.: Time period, for which data is selected |
Rows
|
InfoObject |
Description of the InfoObject (Restriction or Calculation Formula) |
|
0TIME |
Columns
|
InfoObject |
Description of the InfoObject (Restriction or Calculation Formula) |
|
0BWTC_C10_S005 |
Example