 Data Input Tables and How They Are Interpreted

Data Input Tables and How They Are Interpreted
SAP Business Graphics accepts input in the form of tables. A table can contain a single list of numbers, or a set of rows and columns. You can also input multiple tables, each of which has rows and columns. This section illustrates how these data tables are graphed.
Data Values in a Simple List
When the data occurs in a simple list, SAP Business Graphics creates a 2D graph (see figure). The list items are laid out along the horizontal axis of the graph. You cannot generate a 3D graph for data that contains only a simple list of values.
Employee Sales: Freezers
|
Column 1 | ||
row1 |
Adriani |
54 |
row2 |
Church |
11 |
row3 |
Gomez |
20 |
row4 |
Wexley |
33 |
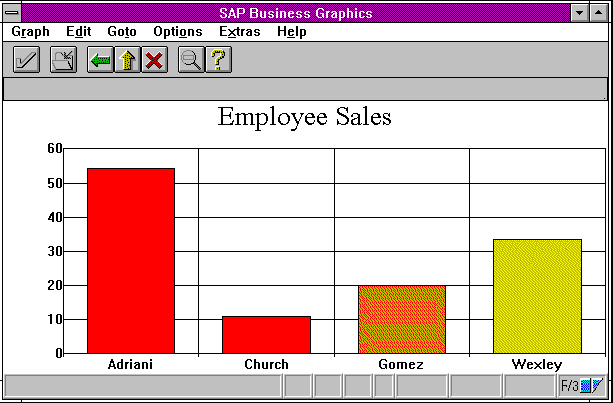
A list of values can be viewed as a table with only rows, or only columns. In either case, the set of rows (or columns) is sometimes referred to as the row dimension.
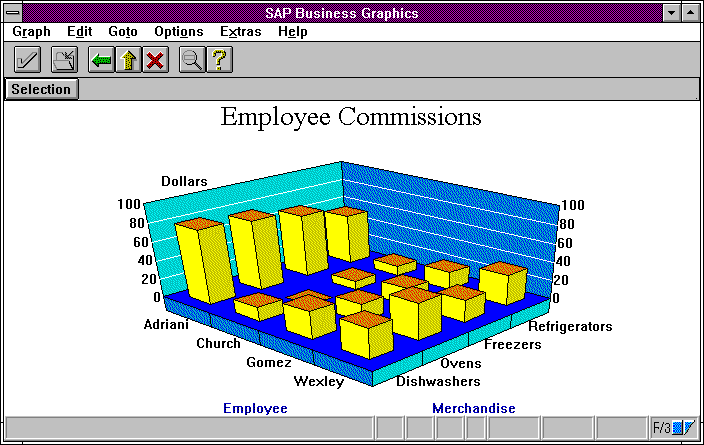
Data Values in a Table
When data is input in a table with rows and columns, SAP Business Graphics creates a 3D graph. This is illustrated by the following figure, which contains data input as a table of values (left) and a 3D graph of the data (right). The rows appear along the left side of the graph floor, and the columns along the right. The actual data values are depicted vertically in the graph.
The set of rows and set of columns are sometimes referred to as the "row" and "column dimensions." Individual rows or columns are referred to as "dimension elements."
Employee Sales: First Quarter
|
column 1 |
column 2 |
column 3 |
column 4 | ||
|
refigerators |
freezers |
ovens |
dishwashers | ||
R1 |
Adriani |
107 |
148 |
165 |
178 |
R2 |
Church |
41 |
36 |
55 |
76 |
R3 |
Gomez |
50 |
57 |
64 |
83 |
R4 |
Wexley |
68 |
54 |
73 |
73 |
You can also create 2D graphs for input data with the form described here. The section
Using the Selection Viewdescribes how to select part or all of your data for display in a 2D graph.Data Values in Multiple Tables
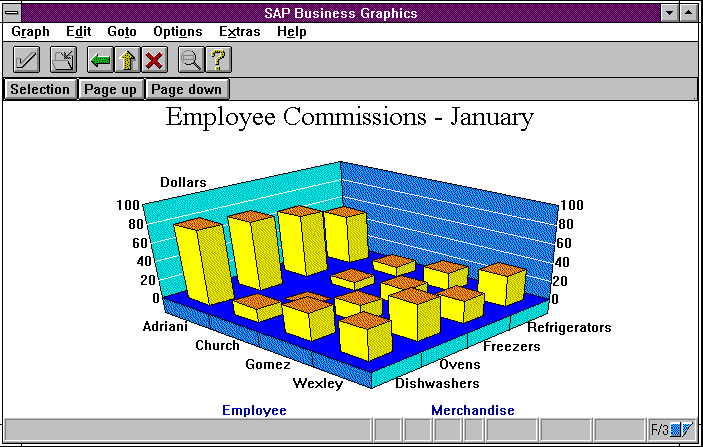
Your data can also include multiple tables, each of which contains rows and columns. The number of rows and columns must be the same from table to table: the table never changes size.
For data in this format, SAP Business Graphics creates a 3D graph for each one of your tables. This is illustrated by the following figure, which contains data input in multiple tables (each with rows and columns). The rows and columns remain the same from graph to graph; only the data values change.
Employee Commissions: January
|
column 1 |
column 2 |
column 3 |
column 4 | ||
|
refrigerators |
freezers |
ovens |
dishwashers | ||
row 1 |
Adriani |
54 |
67 |
75 |
80 |
row 2 |
Church |
11 |
9 |
0 |
14 |
row 3 |
Gomez |
20 |
18 |
18 |
29 |
row 4 |
Wexley |
33 |
24 |
38 |
32 |
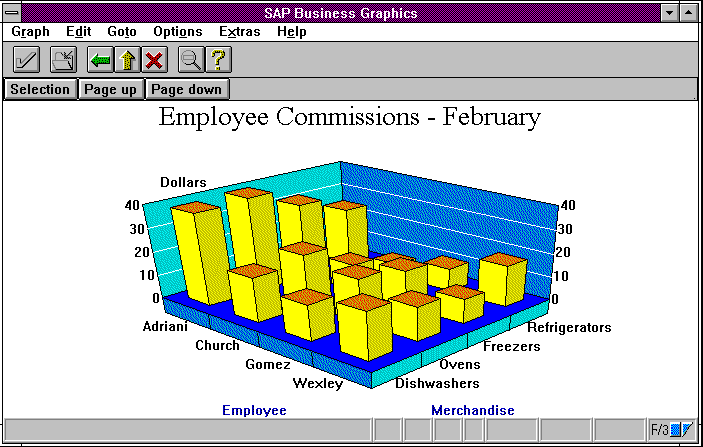
Employee Commissions: February | |||||||||
|
column 1 |
column 2 |
column 3 |
column 4 | ||||||
|
refrigerators |
freezers |
ovens |
dishwashers | ||||||
row 1 |
Adriani |
24 |
32 |
40 |
38 | ||||
row 2 |
Church |
5 |
11 |
22 |
18 | ||||
row 3 |
Gomez |
10 |
15 |
18 |
15 | ||||
row 4 |
Wexley |
17 |
10 |
14 |
20 | ||||
Employee Commissions: March | |||||||||
|
column 11 |
column 12 |
column 13 |
column 14 | ||||||
|
refrigerators |
freezers |
ovens |
dishwashers | ||||||
row 1 |
Adriani |
29 |
49 |
50 |
60 | ||||
row 2 |
Church |
25 |
16 |
33 |
44 | ||||
row 3 |
Gomez |
20 |
24 |
28 |
39 | ||||
row 4 |
Wexley |
18 |
20 |
21 |
21 | ||||
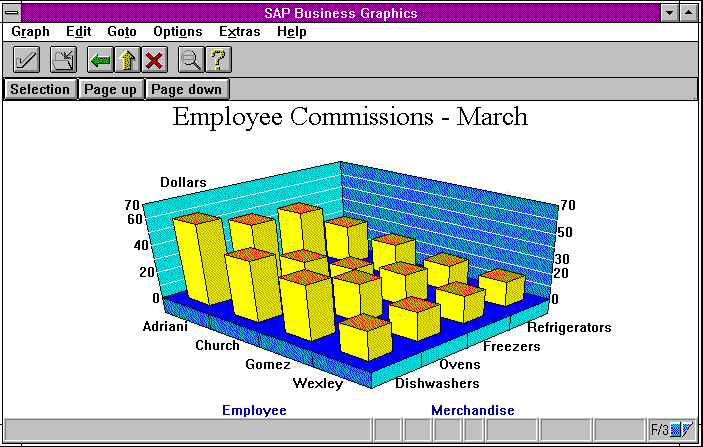
Because you can page through these 3D graphs, the set of table-names is referred to as the "pages" or "page dimension." Each page, like each row or column, has a name, and this name appears as part of the title of the graph.

Data input may contain a maximum of 32 items per dimension, that is, 32 rows, 32 columns or 32 pages. However, the total number of input values may not exceed 1024. Hence the product of the number of rows, number of columns, and number of pages, in respecting this limit, must always be less than or equal to 1024.