
 Using the Portal Activity Report
Purpose
The portal activity report feature consists of a data collection service that gathers raw data about portal activity, an aggregation application that summarizes the raw data into aggregated data that can be displayed in reports, and an iView template for creating iViews that display the aggregated data.
Process Flow
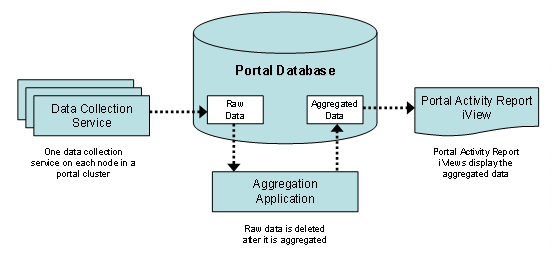
The following diagram shows the flow of data that eventually is displayed in portal activity reports:
The portal activity report feature is comprised of the following components:
· Data Collection Service
The data collection service gathers raw data from the Portal Runtime (PRT) about logged on users and the pages and iViews that were viewed. There is one data collection service on each node in the portal cluster.
The data is stored in the portal database.
To use the portal activity report feature, you must activate the data collection service. See Starting and Configuring the Data Collection Service.
· Aggregator Application
A standalone program that combines the collected data from all the nodes in the portal cluster and, based on this data, generates aggregated data about users and their use of portal content. This aggregated data is also stored in the portal database.
The aggregator application deletes the data collection service’s raw data after generating the aggregated data.
The aggregator application can be installed on any machine in the organization’s network that has JDBC connectivity to the portal database.
To use the portal activity report feature, you must set up the aggregator application. See Setting Up the Aggregator Application.

The data collection service generates a tremendous amount of data, which is deleted as it is aggregated. If you do not run the aggregator application, not only will no data be generated for the portal activity report iViews, but the size of your database will grow very large.
· Portal Activity Report iView Template
A template from which you can create iViews for displaying the aggregated portal activity data. Each iView can be configured to show different types of data, as well as data for different time periods.
Each iView generates a report whose data can be saved as a comma-delimited file (*.csv).