
 Preparing the Debugging Process
Productive and Debug Nodes
In a production system, most of the nodes are reserved for the Web AS and therefore have the status Productive. Productive server nodes can thus not be used fro debugging. All other nodes in a cluster can be switched between run and debugging modes, provided these nodes can be isolated from load-balancing. Therefore, the debug nodes in the cluster must also have the status Restricted Load Balancing.
Example
In the following example of a cluster configuration, the two server nodes Server1 and ServerN could, in principle, be switched to debugging mode as debug nodes. However, Server1 cannot be used for debugging, because this server node cannot be isolated from the cluster communication. The reason for this is that the value of Restricted Load Balancing for Server1 is set to NO. In this cluster configuration, only the server node ServerN can be used for debugging.
Prerequisites
The following prerequisites must be met for you to be able to create a Java debug connection:
· The server node to be debugged is not a productive node. In a cluster configuration, this node must also have the status Restricted Load Balancing.
· There must be a valid debug port.
· You are using the Developer Studio as your Java development environment.
· A debug connection cannot be established from the Developer Studio if the server is behind a firewall.
· (The only exception is the WAN scenario, which enables remote debugging on the customer side from SAP.)
Status Information in the Developer Studio
Information about the status of individual server nodes is available in the J2EE Engine view in the Developer Studio. If you have not already done so, you can add this view by choosing Window à Show View à J2EE à J2EE Engine.
Before you activate debugging, you should first check the default server settings in the Developer Studio.
Setting Up the J2EE Engine in the Developer Studio
1. Choose Window à Preferences and then choose the entry SAPJ2EE Engine on the left of the screen.
2. Specify the installation option.
You can generally choose between the two options remote installation and local installation.
If you choose the option for the remote installation (SAP J2EE Engine is installed on remote host), enter the Message Server Host and Message Server Port.
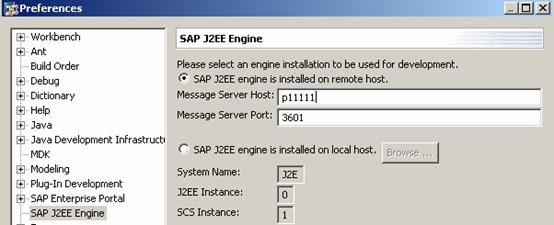
With this option, you can also address your local server by entering localhost as the message server host.
Otherwise, choose the local installation option (SAP J2EE Engine is installed on local host). Choose Browse to assign the relevant system name.
3. Choose OK to save your settings.