Parameter Reporting
Use
You can look at the general parameters of the Portal Runtime and Portal Runtime cache as well as the configuration parameters of the Portal Runtime (PRT) and Portal Content Directory (PCD). You can also check if all the necessary services and filters have been loaded.
Integration
You have three ways to call the function:
1. in the Visual Administrator
2. in the CCMS with the SAP Solution Manager
3. in the Portal
Features
You can look at the different parameters and refresh the display if needed. The status of the parameters is marked with certain symbols.

The number of parameters and the use of the symbols varies depending on which of the above alternatives you are using for display.
For more
information about the meaning of the individual PCD parameters, see PCDStartup.Properties
Configuration File. For the PRT parameters, read the section  File-Based
Configuration Properties in the Portal Runtime guidelines.
File-Based
Configuration Properties in the Portal Runtime guidelines.
Activities
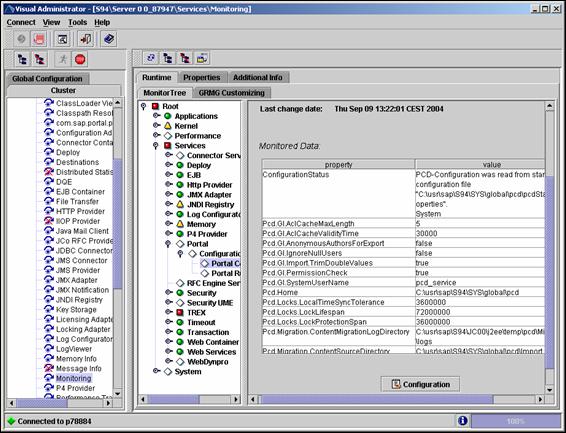
Parameter Reporting in the Visual Administrator
· Select the corresponding Server ® Services ® Monitoring.
· On tab MonitorTree select Root ® Services ® Portal.
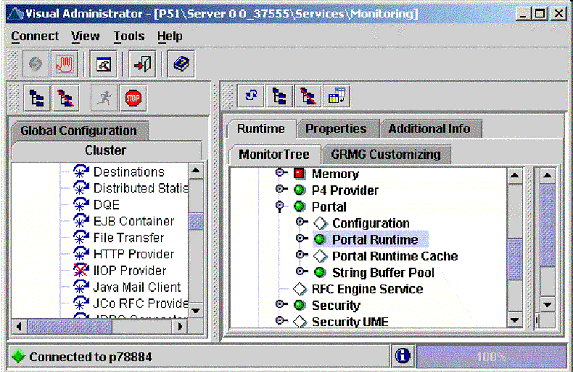
· Open the required subnode in order to see the parameter data.
The properties are displayed in a table together with the corresponding values.
To display the configuration parameters choose Configuration and then the entry Portal Content Directory or Portal Runtime. Node String Buffer Pool shows the data obtained when you render iViews and build pages.
By default the parameters are reported to the Visual Administrator every 10 minutes. To change this time interval:
· Choose Configuration.
· In the window Monitor Configuration click on Edit and enter the required time span in minutes, hours or days.
Troubleshooting
·
The entry
Portal is missing on tab Monitor Tree.
® Check
file monitor-configuration.xml. This file is
stored in the PRT service in com.sap.portal.prt.sapj2ee.
·
No
configuration parameters are displayed.
® Check
service com.sap.supportability.reporting in
directory ..\WEB-INF\deployment\pcd.
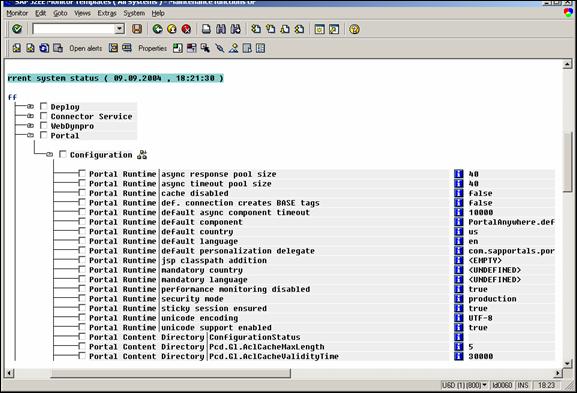
Parameter Reporting in the CCMS
For detailed
information about implementing and configuring portal monitoring in the CCMS,
see Configuration of the
Monitoring Architecture.
After configuration of portal monitoring in the CCMS, the parameters are displayed as follows:
· In the CCMS monitor set (Transaction RZ20) choose J2EE Monitor Templates ® All Systems ® <System_Name> ® J2EE Engines ® <Instance_Name> ® Services ® Portal
For more information about the Computer Center Management System visit service.sap.com/systemmanagement or see the Computing Center Management System.
For more
information about the SAP Solution Manager visit service.sap.com/solutionmanager or see the
SAP Solution
Manager.
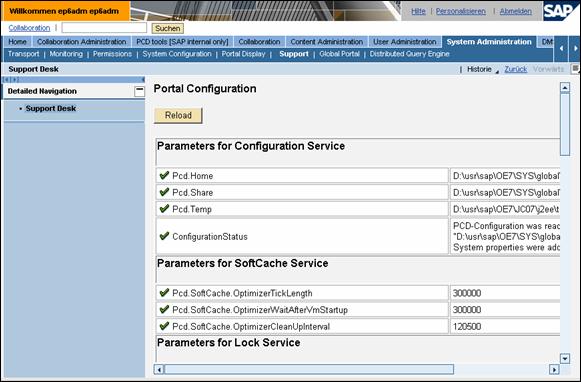
Parameter Reporting in the Portal
To Display Configuration Parameters of the PCD:
· Choose System Administration ® Support ® Support Desk.
· Click on the Portal Content Directory area and then on the Pcd Configuration tool.
The configuration settings of the PCD that were valid when up started the portal are displayed. To refresh the data click on Reload.
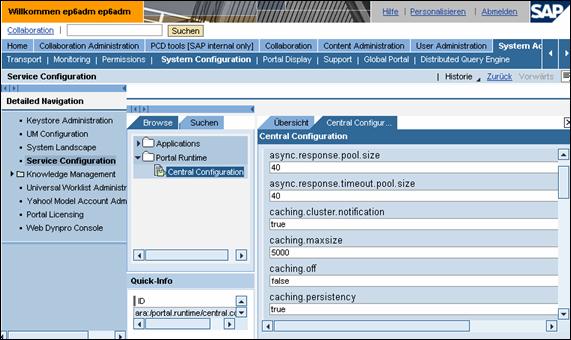
To Display Configuration Parameters of the PRT:
· Choose System Administration ® System Configuration ® Service Configuration
· Select Central Configuration in folder Portal Runtime.
· Click with the secondary mouse button and choose Configure.
The configuration settings of the PCD are displayed.