 Pivot Sorting
Use
You can change the order in which the characteristic values and key figures are displayed in the grid.
Prerequisites
This function is available after you have drilled down at least once using the header (see Using the Header in Interactive Planning ).
Features
When you drill down, the key figures remain on the left and the characteristic values are displayed to the right in the order of the drill-down. With the pivot sort you can change this order without changing the drill-down order.
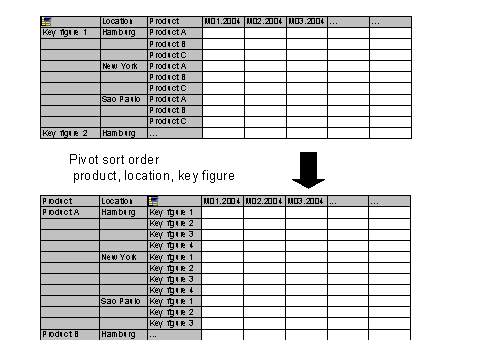
When you call up pivot sorting from the context menu a dialog box appears in which the order of the objects is displayed. If the grid has not been sorted, the top object is the key figures, followed by the first drill-down characteristic and so on. You use drag and drop to rearrange the order. When you have finished, choose
 to transfer these settings to the grid. The sort is only valid for the current drill-down.
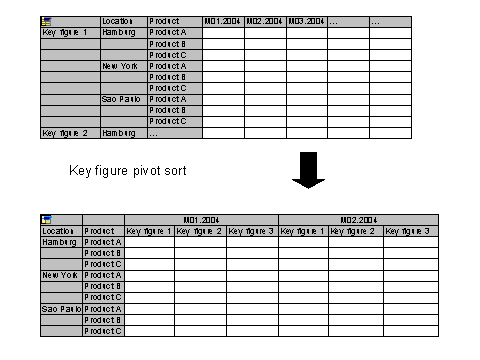
A second option is available in which the key figures are displayed not in the rows but in columns under the period. In this case it is not necessary to have previously carried out a drilldown.
Activities
In both cases you access the function from the context menu for the cell containing the
 icon, which is usually in the top left corner unless you have already carried out a pivot sort. In the case of ‘normal’ pivot sorting a dialog box appears in which you can change the order by using drag&drop. In the case of key figure pivot sorting the system automatically moves the key figures to columns for each period.