 Post-Evaluation
Use
You use this function, for example, to modify actual data that you want to use as the basis for a forecast, taking the effects of a past promotion into account.
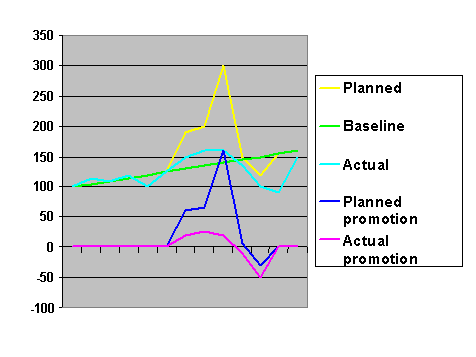
In the figure above, you can see the planned and actual course of a promotion. The planned curve (in yellow) comprises the baseline data and the planned promotion. Similarly, the actual data consists of two components – the underlying trend and short-term promotion. In this case, the actual promotion did not have the desired effect on sales. You want to store the data from the actual promotion on its own so that you can separate it from the underlying trend. For this purpose, you can use the
Post-Promotion
key figure or any other key figure. You can show the
Post-Promotion
key figure with the user parameter
/sapapo/prom_postact
.
Prerequisites
The promotion has been executed so that actual data now exists.
Features
The key figure with the post-promotion values can be calculated as follows:
Post-Promotion = Actual Key Figure – Planned Baseline (planning key figure)
Depending on the settings you make in the univariate profile for forecasting, the system corrects the key figures for producing the forecast in one of two ways:
If you set the
Change values
indicator, the post-promotion values are subtracted from the actual key figure in the promotion period.If you set the
Mark
indicator, the system marks all the periods within the horizon of the promotion in the past and performs outlier correction for these periods. Any historical values that lie outside the tolerance lane are corrected. In this case, you must also set theOutlier correction
indicator and make an entry in theHistorical value markings
field. For more information, see Univariate Forecast and the relevant sections on this topic.