 Functions for Editing Hierarchies
Characteristics are displayed hierarchically using different levels. As shown above, the number of levels to be displayed can be set using the symbols
collapsed
(
+
) and
expanded
(
-
).
Expanding a hierarchy level means displaying one level below the level where the cursor is positioned.
Collapsing means reducing the display by one level.
It is also possible to process the levels of a hierarchy in greater detail using the menu. These functions are cursor-sensitive. Thus they let you process the rows in a specific branch.
 Example
See the graphic exemplifying compact display in the section Hierarchy Display .
For example, in the graphic below, if you execute the function
Collapse
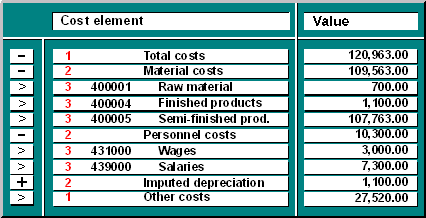
on Level 1 of the first branch, the system resets all the items which belong to that branch, and only displays Level 1 of the branch. Other branches are not affected. If you execute this function on the row "Material costs", the items "Raw material", "Finished products" and "Semi-finished products" disappear.
The function
Expand
is likewise cursor-sensitive, and only applies to the next level.
The function
Expand all
always displays all the levels contained in the branch.
Expand to level
lets you hide levels of the hierarchy which are of no interest at the time or unimportant.
The function
Set focus
lets you choose a specific level that you are particularly interested in. For example, if you position the cursor on the row "Personnel costs" in the graphic, and then chooseSet focus
, the system displays only the expanded level, i.e. the rows "Personnel costs", "labor costs" and "Salaries". You can jump from this focused view back to the hierarchy again by double-clicking on the corresponding field.
Sorting a hierarchy
You can sort a report according to different criteria. Depending on where the cursor is standing, you can sort the rows according to the key, the name or the values of a certain key figure in either ascending or descending order.
You can also sort a report hierarchically, provided that a characteristic was defined hierarchically. Again you can choose between ascending and descending order. The cursor must be positioned on a symbol (+, -, >) before you choose the function
Ascending
or
Descending
. The hierarchies shown in the figures here are all sorted in descending order.
In compact display and asterisk display, there are also two ways to display the hierarchy. You can have the highest level (Level 1) above the lower levels, or you can place it at the bottom of the branch. The first case is referred to as top-down display, the second as bottom-up display. The figures shown here are displayed top-down.
Graphics for hierarchy lists
Only the line-related graphic types are available in a hierarchy list.
 Note
Note
If you want to observe just one level of a hierarchy, using the function

Hierarchy

Set level
, all graphic types are available - depending on the cursor position - as in a drilldown list without a hierarchy.

See also: